Contents
I. What Is an Image Histogram
An image histogram is a statistical feature of image pixel values. It is inexpensive to compute and has many advantages, including invariance to image translation, rotation, and scaling. It is widely used across image processing, especially for grayscale image thresholding, color-based image retrieval, image classification, and backprojection tracking. Common types are grayscale histograms and color histograms.
Simply put, to a computer an image is just the values of individual pixels, and those pixel values fall within a certain range, so we can count how often each value appears—the statistical result is a histogram.
After operations such as translating or rotating an image, its histogram information does not change. Therefore, even if two images have identical histograms, they may not be the same image.
II. How to Compute an Image Histogram
OpenCV provides the following function for computing an image histogram:
void calcHist(
		const Mat* 		images,			//源图像组
		int 			nimages,		//源图像组图像个数
		const int* 		channels,		//图像信道
		InputArray 		mask,			//可选的掩码,如果不为空,则必须是8-bit数组,而且大小和原图像相同
		OutputArray 	hist,			//输出直方图数组
		int 			dims,			//处理直方图的维数正数
		const int* 		histSize,		//每一维的直方图的尺寸大小
		const float** 	ranges,			//直方图每一维的数据大小范围
		bool 			uniform=true,
		bool		 	accumulate=false
);
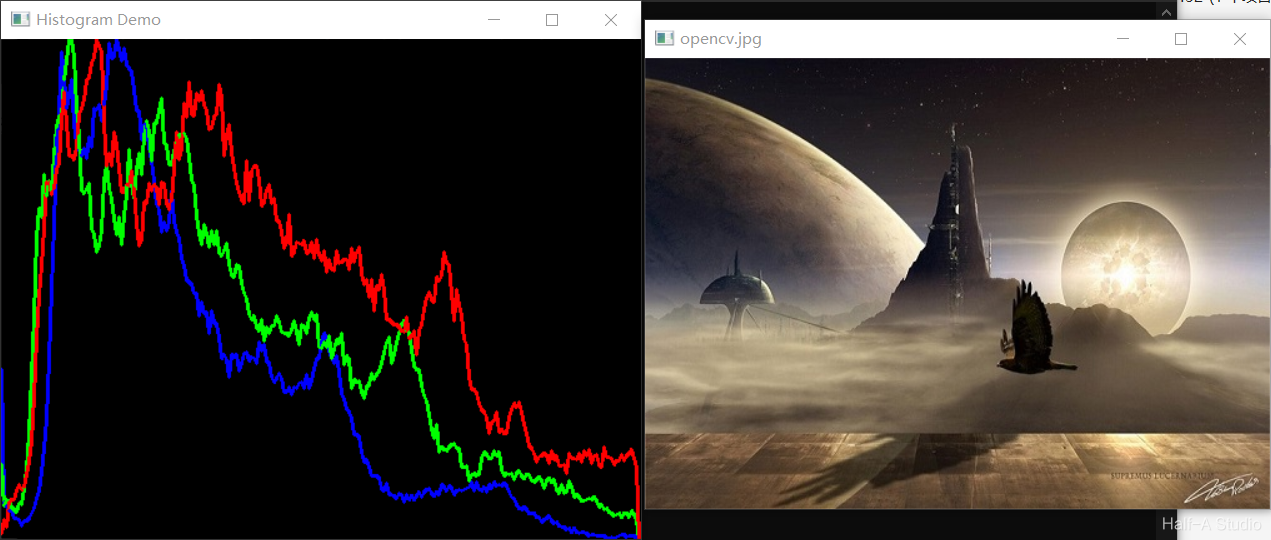
An example program is shown below:
void MyDemo::histShow_Demo(Mat& image) {
	// 三通道分离,用于分别绘制三个通道的直方图
	std::vector<Mat> bgr_plane;
	split(image, bgr_plane);
	// 定义参数变量
	const int channels[1] = { 0 };
	const int bins[1] = { 256 };
	float hranges[2] = { 0,255 };
	const float* ranges[1] = { hranges };
	Mat b_hist;
	Mat g_hist;
	Mat r_hist;
	// 计算Blue, Green, Red通道的直方图
	calcHist(&bgr_plane[0], 1, 0, Mat(), b_hist, 1, bins, ranges);
	calcHist(&bgr_plane[1], 1, 0, Mat(), g_hist, 1, bins, ranges);
	calcHist(&bgr_plane[2], 1, 0, Mat(), r_hist, 1, bins, ranges);

	// 显示直方图
	int hist_w = 512;
	int hist_h = 400;
	int bin_w = cvRound((double)hist_w / bins[0]);
	Mat histImage = Mat::zeros(hist_h, hist_w, CV_8UC3);
	// 归一化直方图数据
	normalize(b_hist, b_hist, 0, histImage.rows, NORM_MINMAX, -1, Mat());
	normalize(g_hist, g_hist, 0, histImage.rows, NORM_MINMAX, -1, Mat());
	normalize(r_hist, r_hist, 0, histImage.rows, NORM_MINMAX, -1, Mat());
	// 绘制直方图曲线
	for (int i = 1; i < bins[0]; i++) {
		line(histImage, Point(bin_w * (i - 1), hist_h - cvRound(b_hist.at<float>(i - 1))),
			Point(bin_w * (i), hist_h - cvRound(b_hist.at<float>(i))), Scalar(255, 0, 0), 2, 8, 0);
		line(histImage, Point(bin_w * (i - 1), hist_h - cvRound(g_hist.at<float>(i - 1))),
			Point(bin_w * (i), hist_h - cvRound(g_hist.at<float>(i))), Scalar(0, 255, 0), 2, 8, 0);
		line(histImage, Point(bin_w * (i - 1), hist_h - cvRound(r_hist.at<float>(i - 1))),
			Point(bin_w * (i), hist_h - cvRound(r_hist.at<float>(i))), Scalar(0, 0, 255), 2, 8, 0);
	}
	// 显示直方图
	namedWindow("Histogram Demo", WINDOW_AUTOSIZE);
	imshow("Histogram Demo", histImage);
}
III. Two-Dimensional Histograms
We know that although RGB has three channels, in the HSV color space only H and S represent color, while V represents brightness. Therefore, representing an image’s color requires only two dimensions, H and S, which can form a planar histogram.
Computing a two-dimensional histogram uses the same function as a one-dimensional histogram. The approach is as follows:
void MyDemo::histShow2_Demo(Mat& image) {
	// 2D 直方图
	Mat hsv, hs_hist;
	cvtColor(image, hsv, COLOR_BGR2HSV);	//RGB转HSV
	int hbins = 30, sbins = 32;				//设置二维直方图的直方个数
	int hist_bins[] = { hbins, sbins };
	float h_range[] = { 0, 180 };			//H:0-180
	float s_range[] = { 0, 256 };			//S:0-256
	const float* hs_ranges[] = { h_range, s_range };
	int hs_channels[] = { 0, 1 };			//选择通道0和通道1
	calcHist(&hsv, 1, hs_channels, Mat(), hs_hist, 2, hist_bins, hs_ranges, true, false);

	//进行归一化
	double maxVal = 0;
	minMaxLoc(hs_hist, 0, &maxVal, 0, 0);	//找到最大值
	int scale = 10;
	Mat hist2d_image = Mat::zeros(sbins * scale, hbins * scale, CV_8UC3);
	for (int h = 0; h < hbins; h++) {
		for (int s = 0; s < sbins; s++)
		{
			float binVal = hs_hist.at<float>(h, s);
			int intensity = cvRound(binVal * 255 / maxVal);
			rectangle(hist2d_image, Point(h * scale, s * scale),
				Point((h + 1) * scale - 1, (s + 1) * scale - 1),
				Scalar::all(intensity),
				-1);
		}
	}
	applyColorMap(hist2d_image, hist2d_image, COLORMAP_JET);
	imshow("H-S Histogram", hist2d_image);
}
Comments