GPU Usage
Command:
nvidia-smiOr update the GPU information every 5s:
watch -n 5 nvidia-smi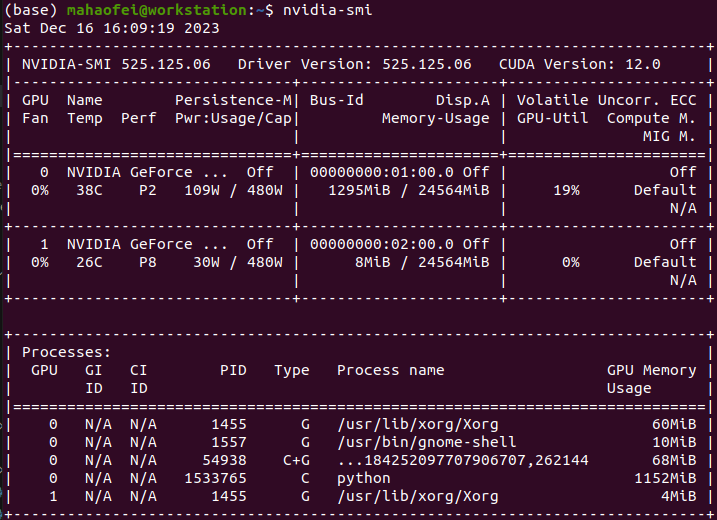
First section:
| NVIDIA-SMI 525.125.06 Driver Version: 525.125.06 CUDA Version: 12.0 |
- Driver Version: GPU driver version
- CUDA Version: CUDA version
Second section:
| GPU Name Persistence-M| Bus-Id Disp.A | Volatile Uncorr. ECC |
- GPU: GPU index, 0, 1, …
- Name: GPU model, for example, NVIDIA GeForce RTX 3090 Ti
| Fan Temp Perf Pwr:Usage/Cap| Memory-Usage | GPU-Util Compute M. |
- Fan: Fan speed, with a minimum of 0 and a maximum of 100%; if the fan is damaged, N/A is displayed
- Temp: GPU temperature in degrees Celsius
- Perf: Performance state, from P0 to P12; P0 indicates maximum performance, while P12 indicates the minimum performance state
- Pwr: GPU power
- Memory Usage: GPU memory usage
- Volatile GPU-Util: Fluctuating GPU utilization
- Compute: Compute mode
Third section:
GPU memory usage for each process
CPU, Memory, and Network
Graphical Interface
The following command is only for graphical interfaces:
gnome-system-monitor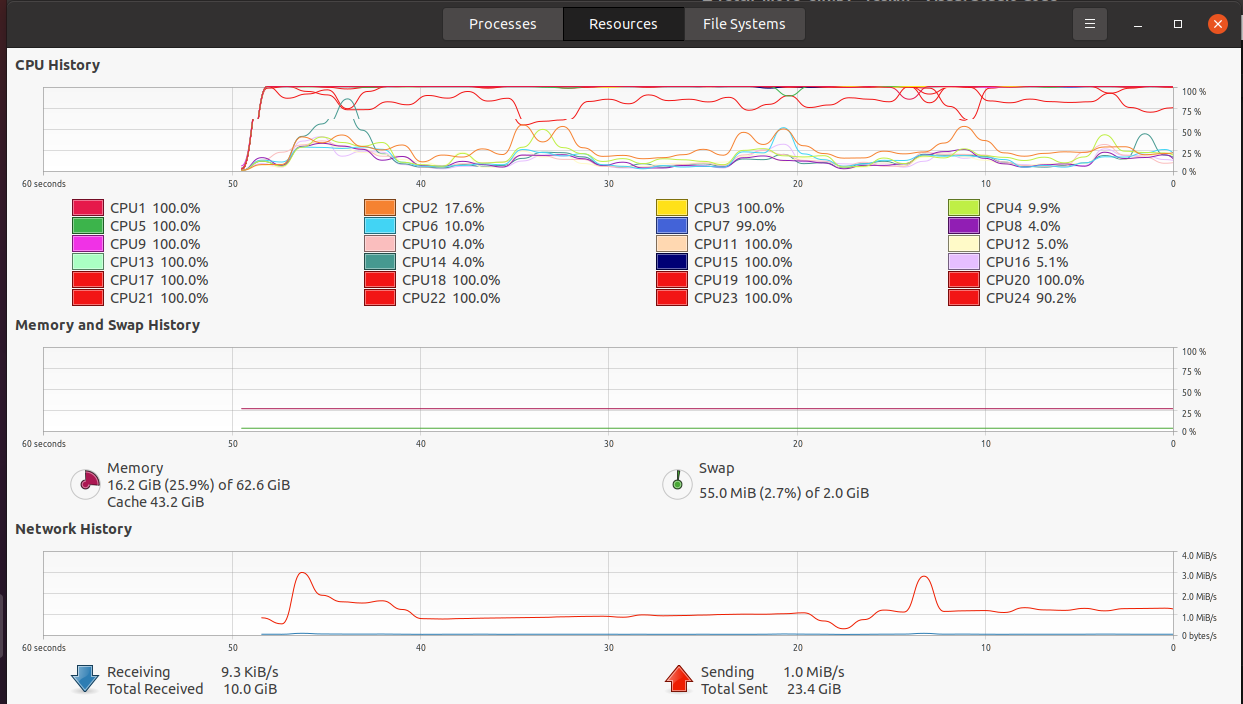
Viewing Memory Usage
free -h -w
- total: Total memory
- used: Used memory
- free: Free memory
- shared: Shared memory
- buffers: Buffers
- cache: Cache
- available: Available memory
CPU
top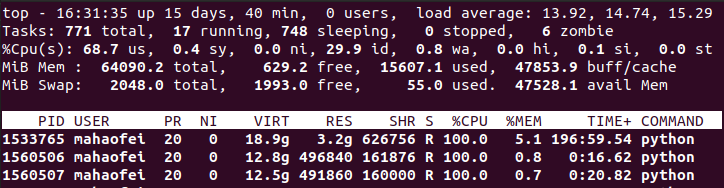
First line (system status):
top - 16:31:54 up 15 days, 41 min, 0 users, load average: 14.45, 14.82, 15.31
- 16:31:54: Current system time
- 15 days, 41 min: The system has been running continuously for 15 days and 41 minutes
- 15 days, 41 min: 0 users are logged in to the system (remote desktop sessions may not be counted)
- load average: 14.45, 14.82, 15.31: Shows the load over the last 1 minute, 5 minutes, and 15 minutes (values calculated by a specific algorithm)
Second line (task process status):
Tasks: 771 total, 17 running, 748 sleeping, 0 stopped, 6 zombie
- Tasks: 771 total: There are 771 processes in total
- 17 running: 17 processes are running
- 748 sleeping: 748 processes are sleeping
- 0 stopped: 0 tasks are stopped
- 6 zombie: 6 tasks are in the zombie state
Third line (CPU status):
%Cpu(s): 67.4 us, 1.0 sy, 0.0 ni, 31.6 id, 0.0 wa, 0.0 hi, 0.0 si, 0.0 st
- 67.4 us: User-space processes account for 67.4% of CPU usage
- 1.0 sy: Kernel-space processes account for 1.0% of CPU usage
- 0.0 ni: Tasks whose priority has been changed account for 0% of system CPU usage
- 31.6 id: The percentage of idle CPU is 31.6%
- 0.0 wa: IO wait accounts for 0% of CPU usage
- 0.0 hi: Hardware interrupts account for 0% of CPU usage
- 0.0 si: Software interrupts account for 0% of CPU usage
Fourth line (memory status):
MiB Mem : 64090.2 total, 596.0 free, 15622.8 used, 47871.4 buff/cache
- 64090.2 total: Total physical memory: 64G
- 596.0 free: Total free memory: 596Mb
- 15622.8 used: Total memory in use: 15622.8Mb
- 47871.4 buff/cache: Cached memory: 47871.4 Mb
Fifth line (swap partition status):
MiB Swap: 2048.0 total, 1993.0 free, 55.0 used. 47513.7 avail Mem
- 2048.0 total: Total swap partition capacity
- 1993.0 free: Free swap partition capacity
- 55.0 used: Swap partition capacity in use
- 47513.7 avail Mem: Buffered swap partition capacity
Sixth line and below (process information):
PID USER PR NI VIRT RES SHR S %CPU %MEM TIME+ COMMAND
- PID: Process id
- USER: Username of the process owner
- PR: Priority
- NI: nice value; a negative value indicates high priority, while a positive value indicates low priority
- VIRT: Total virtual memory used by the process, in kb
- RES: Physical memory used by the process that has not been swapped out, in kb
- SHR: Shared memory size, in kb
- S: Process state. D=uninterruptible sleep R=running S=sleeping T=traced/stopped Z=zombie process
- %CPU: Percentage of CPU time used since the last update
- %MEM: Percentage of physical memory used by the process
- TIME+: Total CPU time used by the process, in 1/100 seconds
- COMMAND: Command name/command line
References:
Comments