Contents
LabVIEW Study Notes: LabVIEW Study Notes (I): Basic Introduction LabVIEW Study Notes (II): Filter Experiment LabVIEW Study Notes (III): Basic Controls LabVIEW Study Notes (IV): Dynamic Data Types LabVIEW Study Notes (V): Comprehensive Data Type Experiment LabVIEW Study Notes (VI): While Loops and For Loops LabVIEW Study Notes (VII): Variables and Shift Registers LabVIEW Study Notes (VIII): Property Nodes LabVIEW Study Notes (IX): Arrays and Clusters LabVIEW Study Notes (X): Case Structures Other Experiment Records
Filter Experiment
1. Main Objective: Learn how to create a VI
2. Procedure:
(1) Place an Express VI on the block diagram
(2) Configure the dialog box that appears
(3) Wire the Express VI
(4) Save and run the VI
3. Experiment
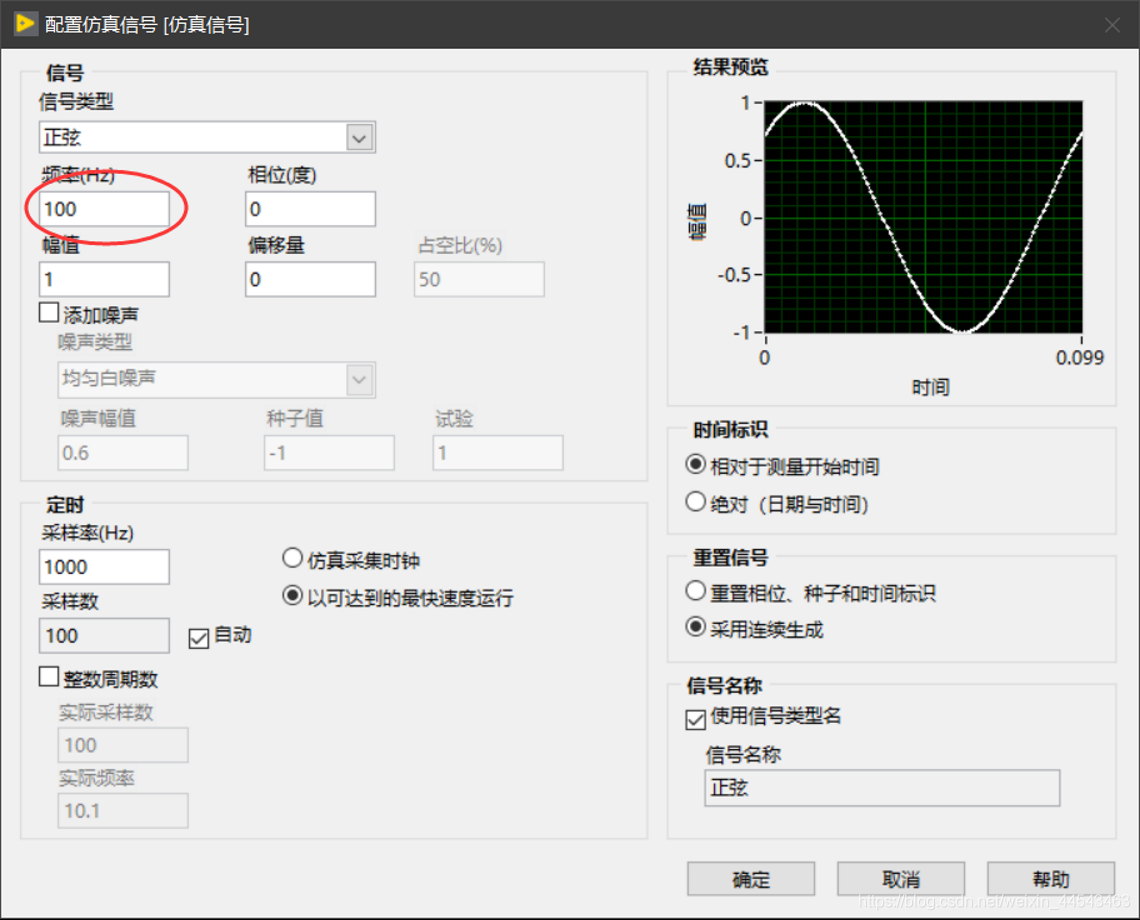
(1) Add a simulated sine signal and configure it, setting the frequency to 100Hz
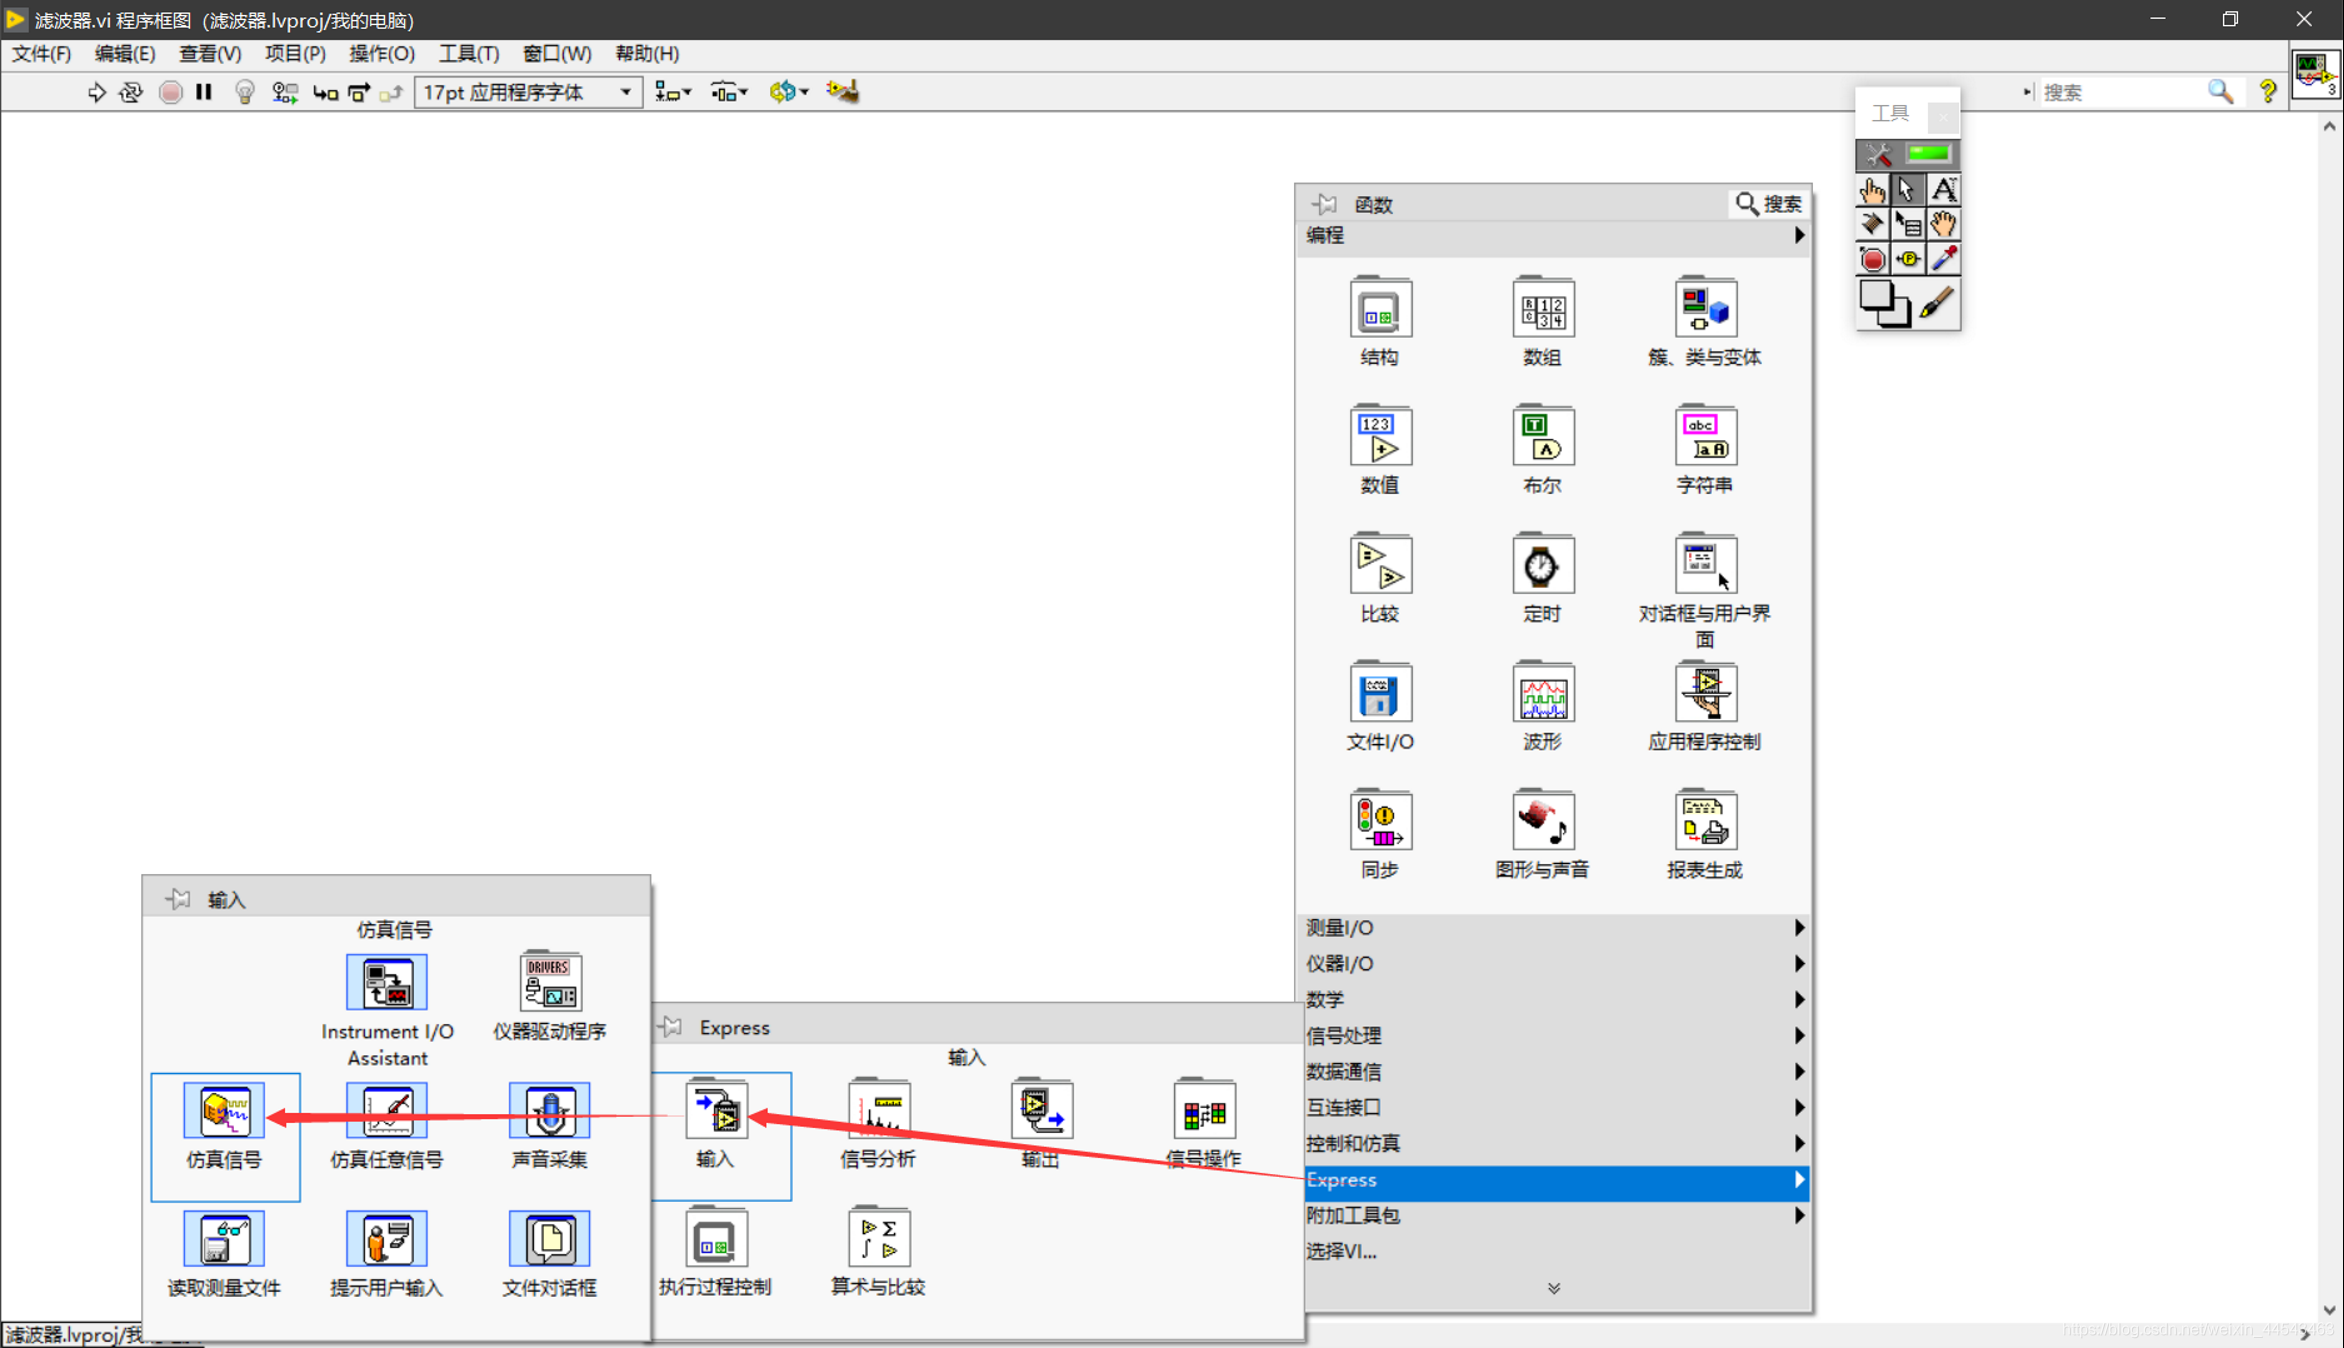
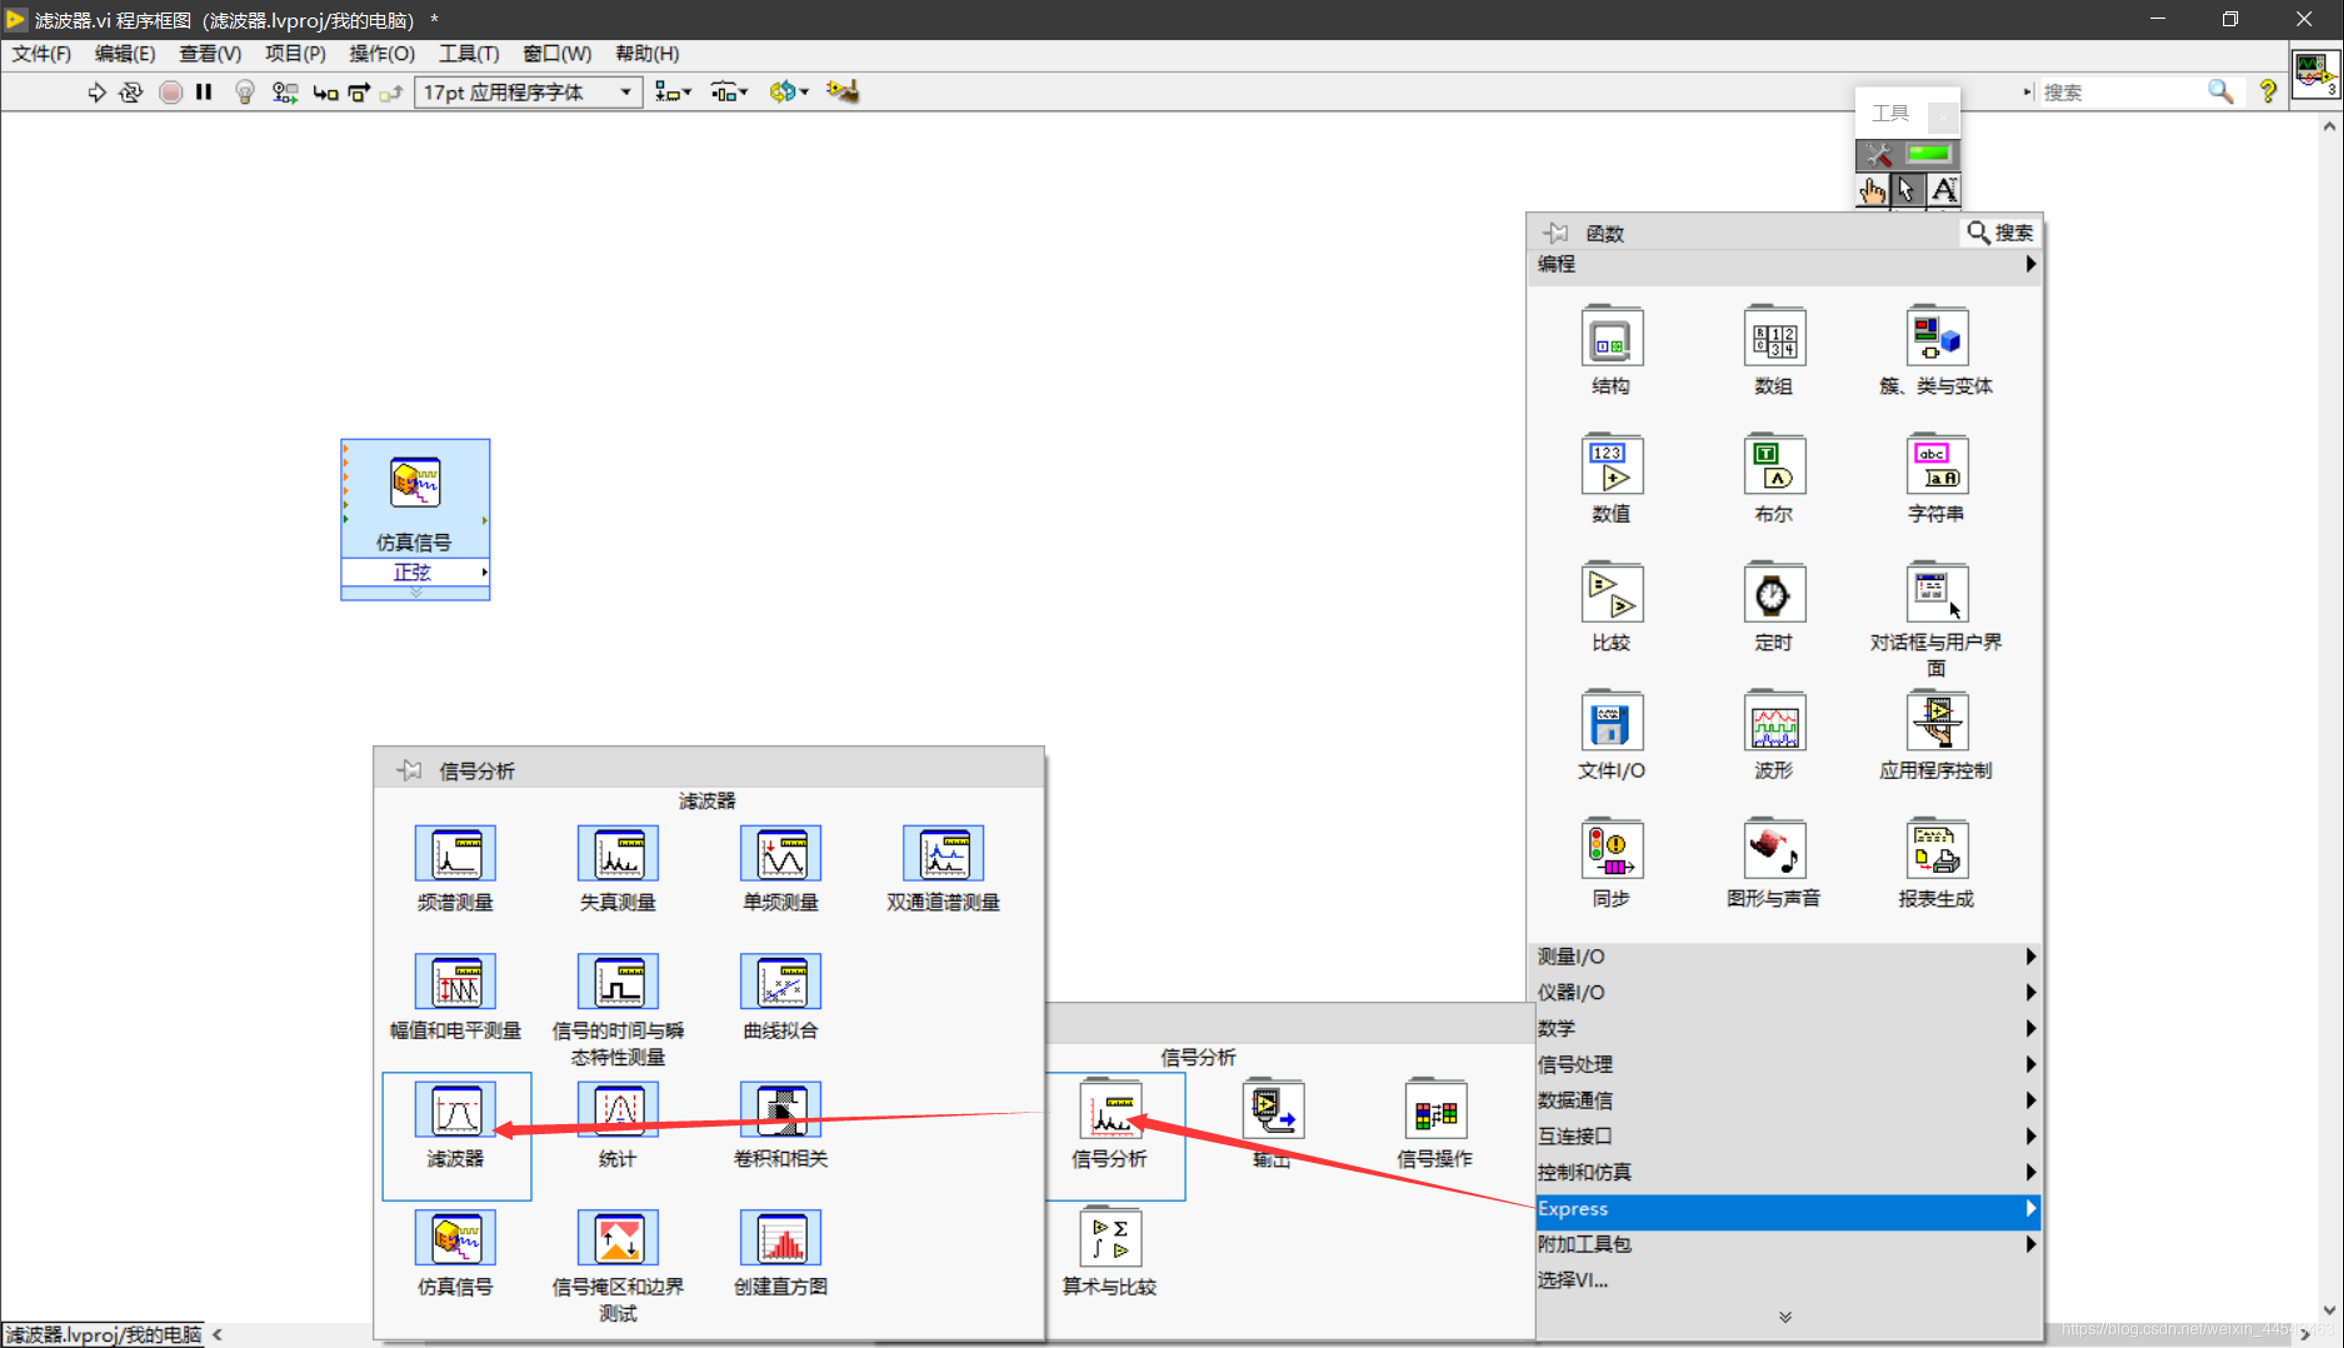
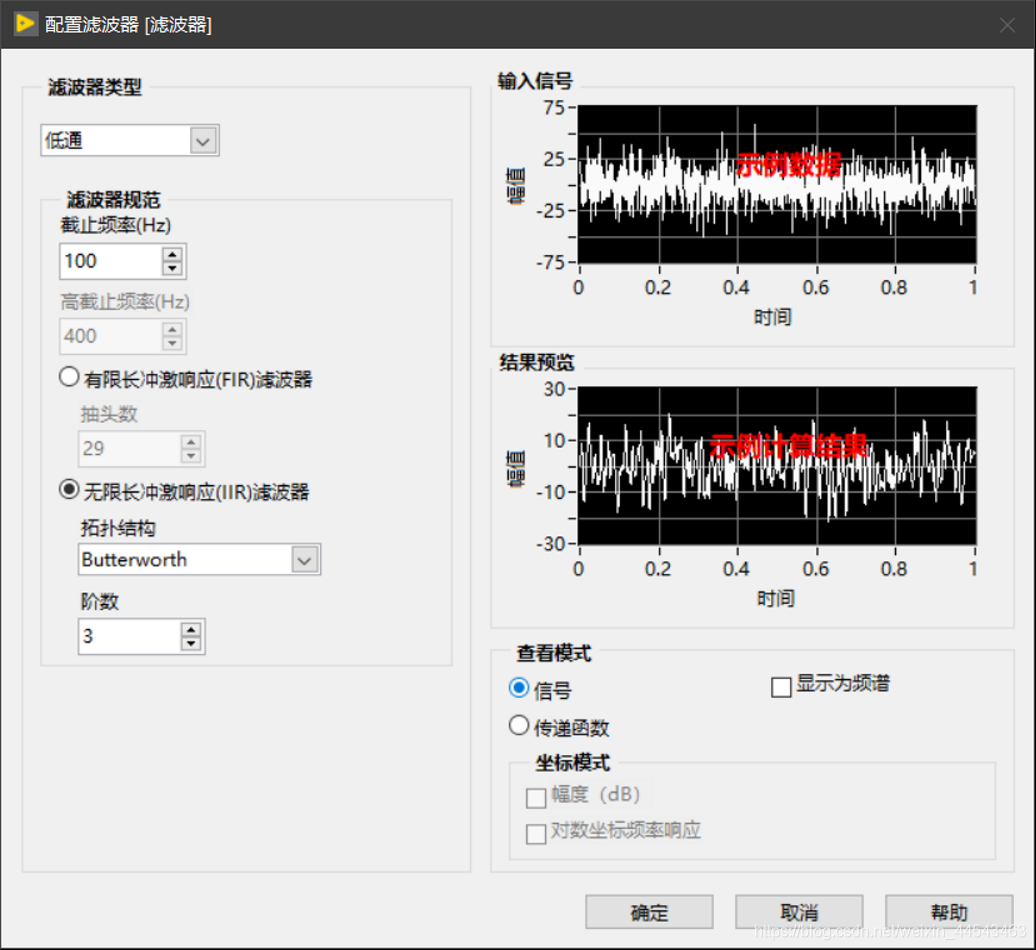
 (2) Add a filter and set the cutoff frequency to 100Hz. Waveforms with frequencies below 100Hz can then be displayed
 (3) Merge the sine signal and the filtered signal
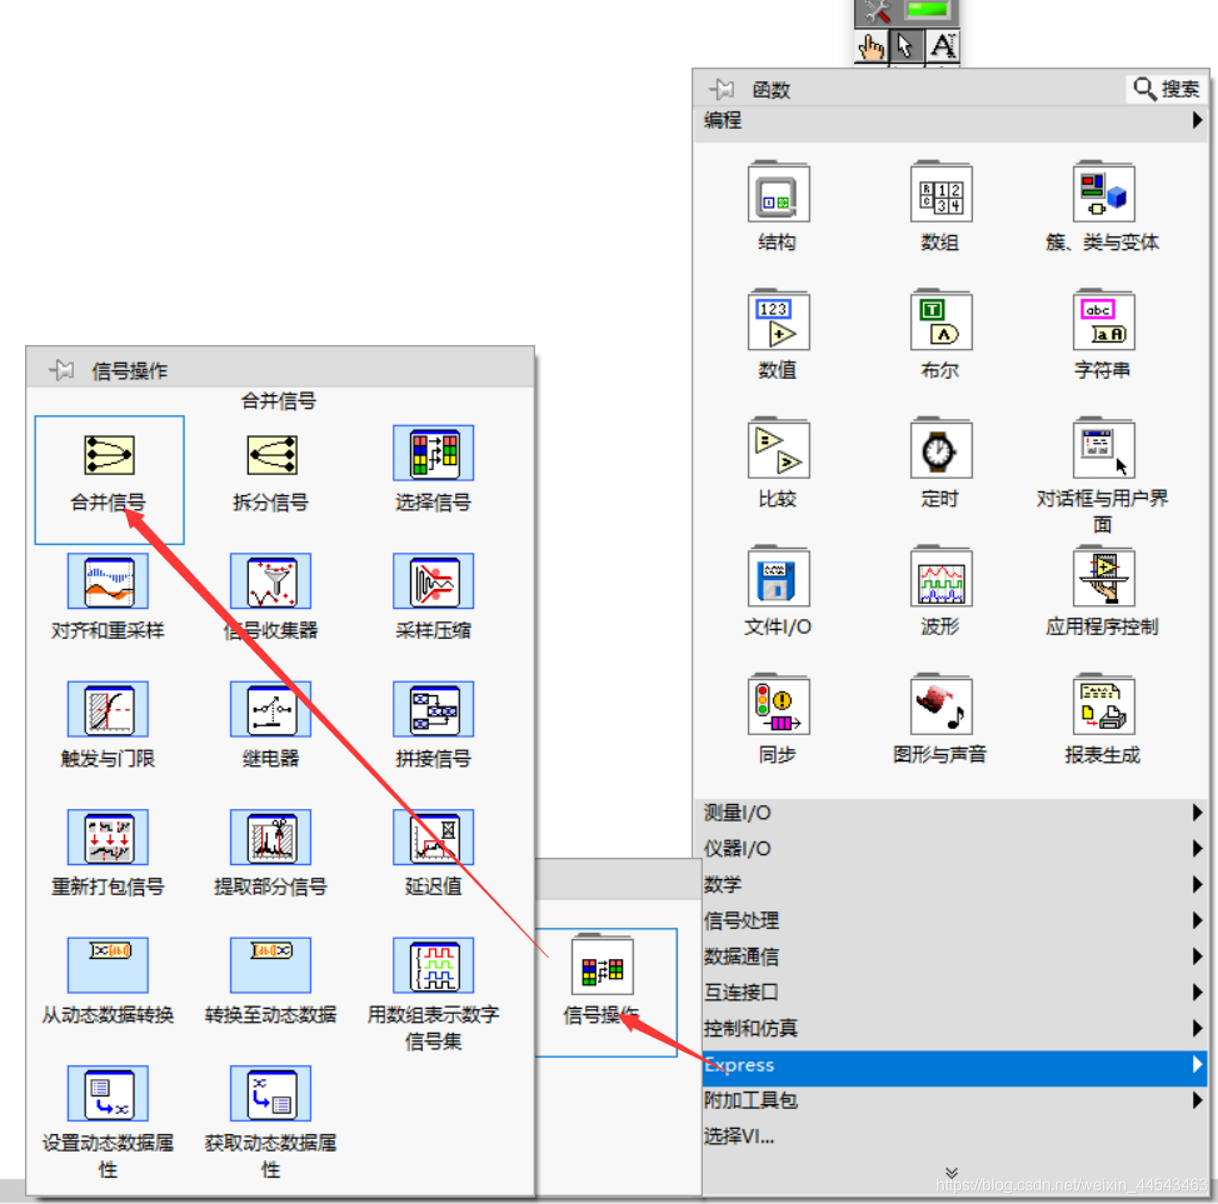
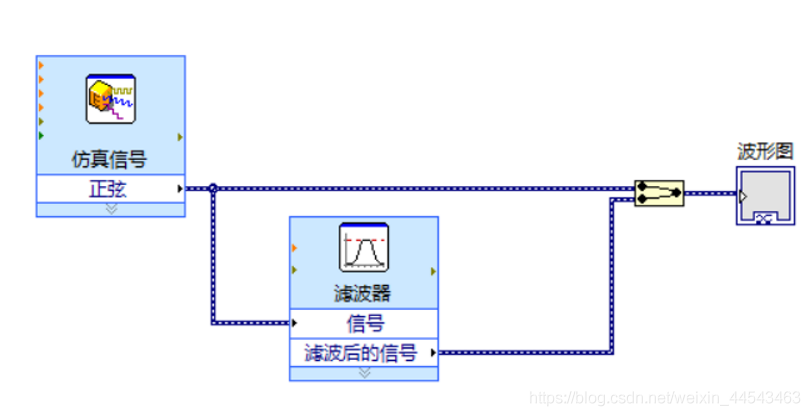
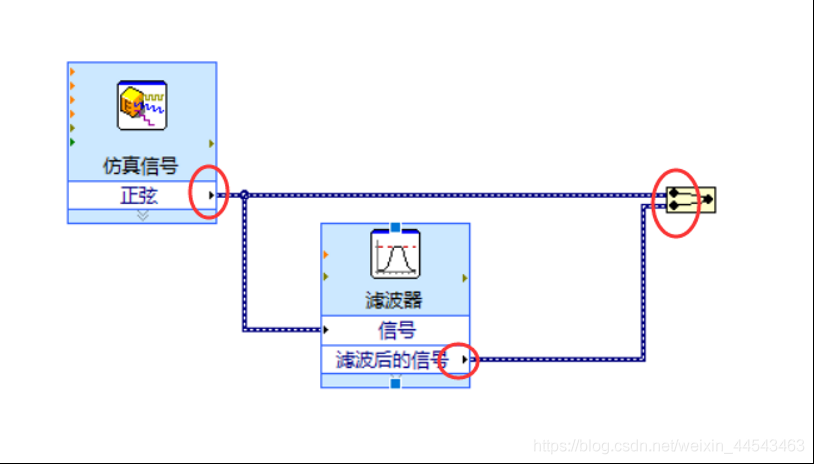 (4) Add a graph display control

 (5) Double-click the generated graph display control to open the front panel, then run the program
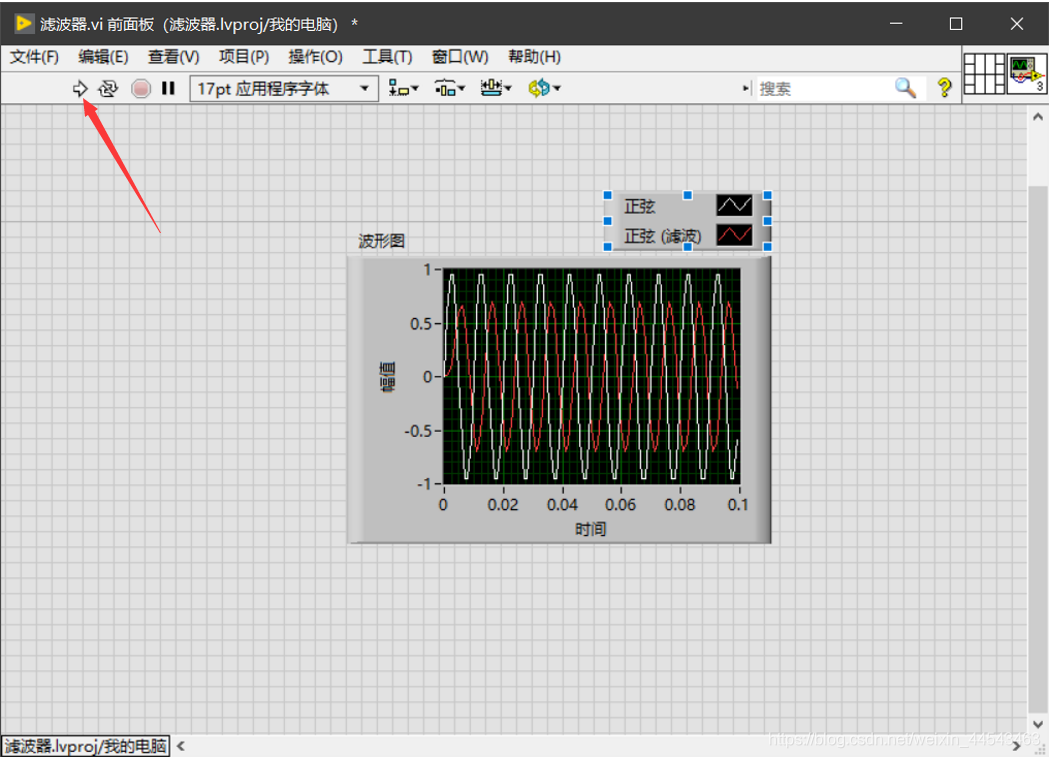 (6) Try modifying the configurations of the sine signal source and the filter, and observe how the curves change
Comments