LabVIEW Study Notes: LabVIEW Study Notes (I): Basic Introduction LabVIEW Study Notes (II): Filter Experiment LabVIEW Study Notes (III): Basic Controls LabVIEW Study Notes (IV): Dynamic Data Types LabVIEW Study Notes (V): Comprehensive Data Type Experiment LabVIEW Study Notes (VI): While Loops and For Loops LabVIEW Study Notes (VII): Variables and Shift Registers LabVIEW Study Notes (VIII): Property Nodes LabVIEW Study Notes (IX): Arrays and Clusters LabVIEW Study Notes (X): Case Structures Other Experiment Records
I. Introduction to Property Nodes
- Property nodes: They provide access to object properties. In applications that may need to programmatically change the appearance of front panel objects in response to specific inputs, these changes can be configured by editing property nodes.
- How to create one: Right-click a control on the block diagram to create a property node. To configure multiple properties, drag the top or bottom border to add properties. The property node executes them from top to bottom.
- Strictly typed property nodes: Creating a property node by right-clicking a control produces an implicitly linked property node. Create a strictly typed property node through a control reference (right-click to create a property node, right-click the control to create a reference, and wire the two together to create a strictly typed property node). When multiple VIs involve properties of the same control, strictly typed property nodes are used to pass them between the VIs.
II. Experiment
- Task requirement: Use a slider to display any section of a waveform graph.
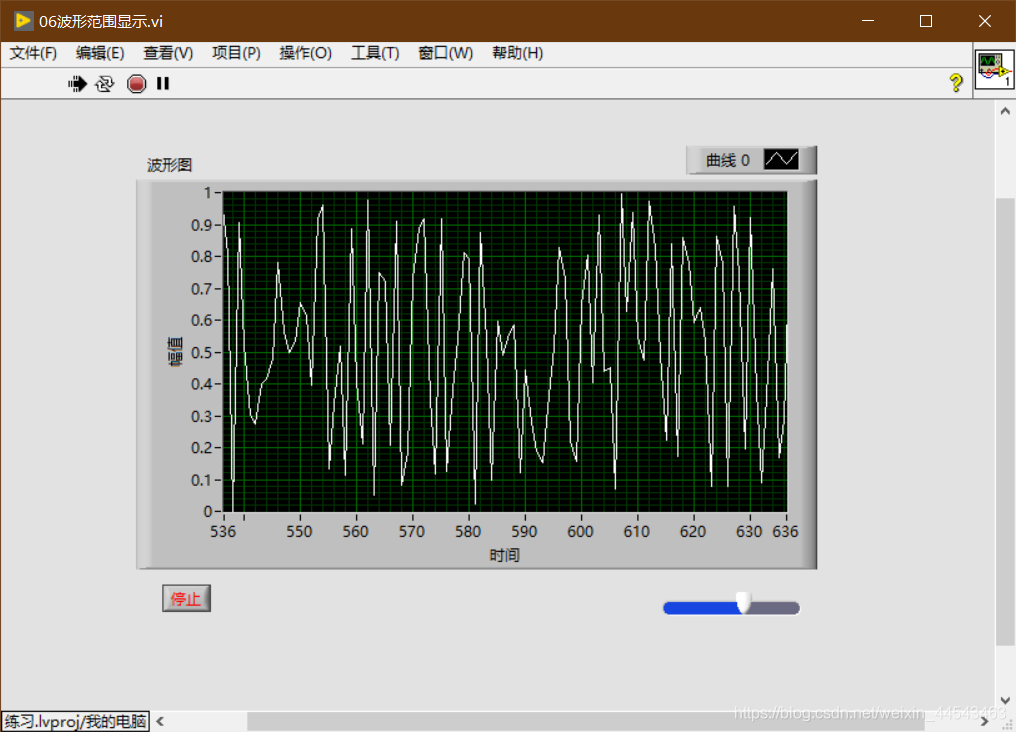
- Implementation:
(1) Use a For Loop to generate 1000 random numbers and display all 1000 points on a waveform graph.
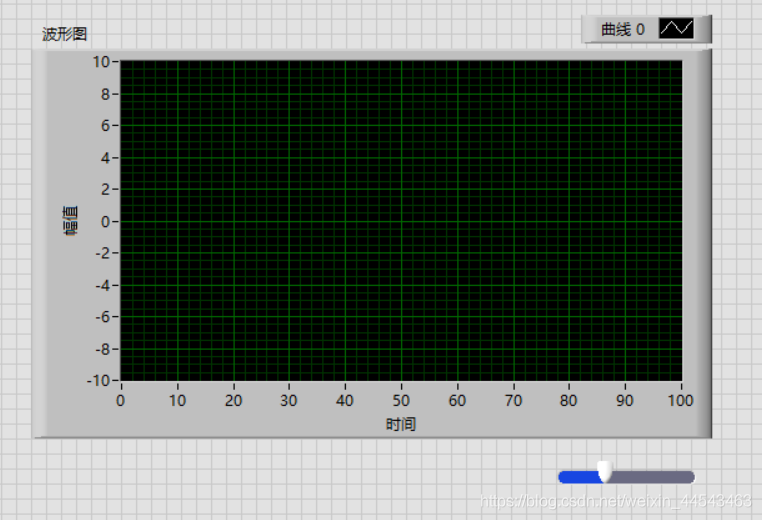
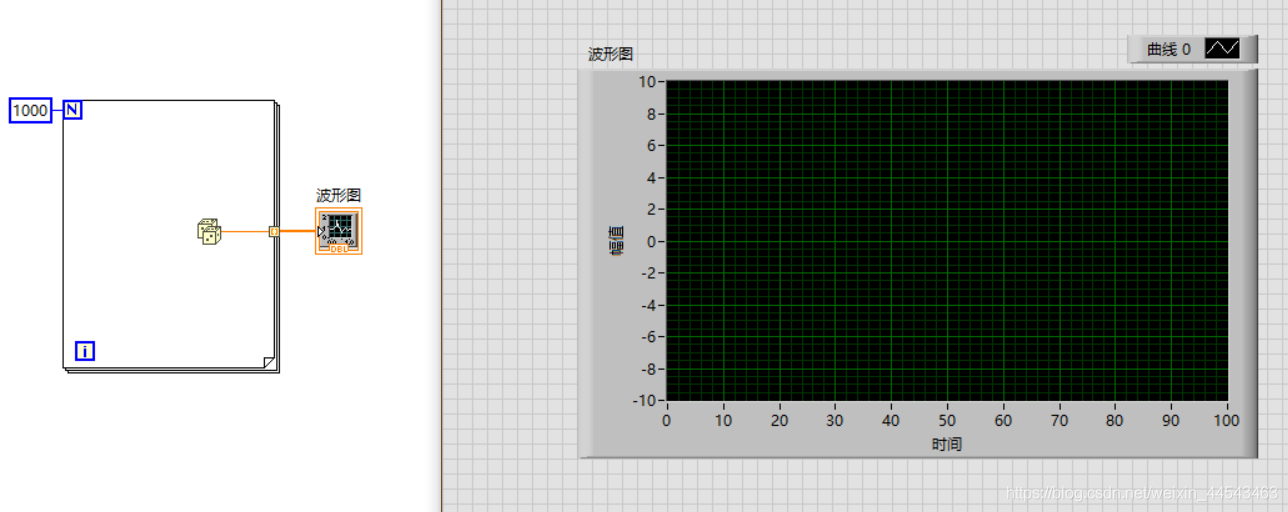 (2) Add a horizontal slider to the front panel as a draggable scrollbar.
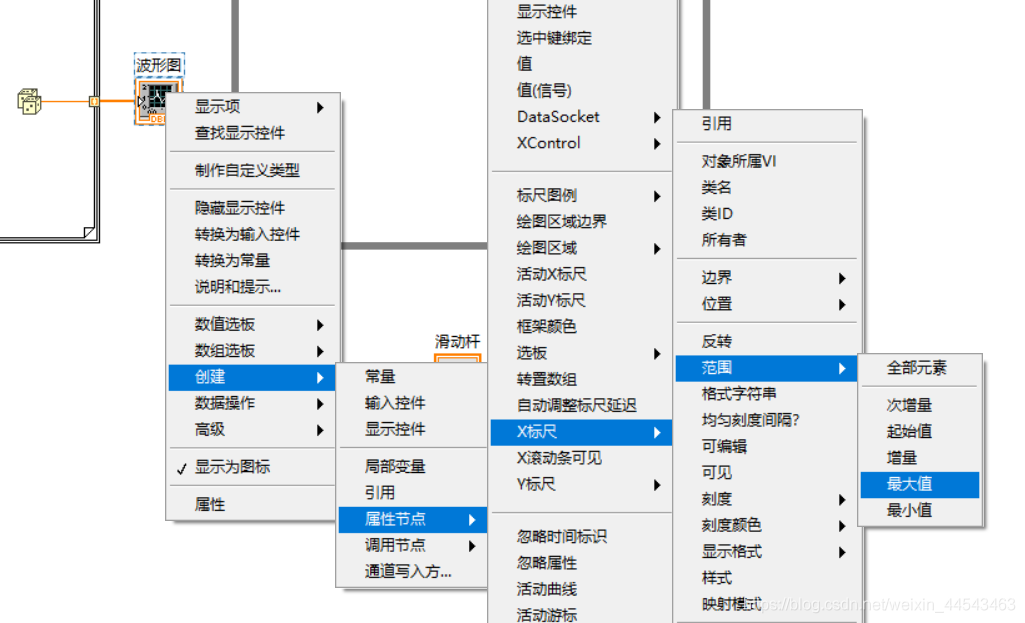
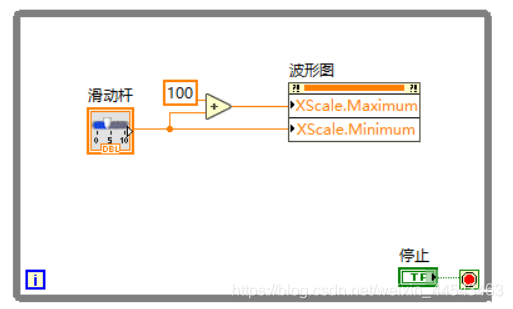
 (3) Because the waveform graph needs to be adjusted in real time, use a While Loop. Inside the While Loop, create property nodes for the waveform graph’s maximum and minimum values, and change them to write mode. Wire the slider output to the waveform graph’s minimum value, and wire the slider output +100 to the waveform graph’s maximum value.
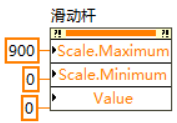
 (4) Set the slider’s properties (maximum and minimum values) to 0 and 900, and set its initial value to 0.
 (5) Wire the error clusters to determine the program’s execution order.
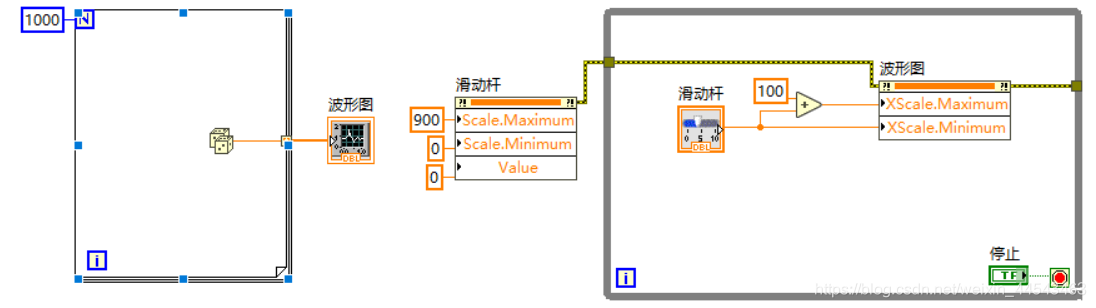 (6) The program design is complete.
Comments