Contents
LabVIEW Learning Notes: LabVIEW Learning Notes (I): Basic Introduction LabVIEW Learning Notes (II): Filter Experiment LabVIEW Learning Notes (III): Basic Controls LabVIEW Learning Notes (IV): Dynamic Data Type LabVIEW Learning Notes (V): A Comprehensive Data Type Exercise LabVIEW Learning Notes (VI): While Loops and For Loops LabVIEW Learning Notes (VII): Variables and Shift Registers LabVIEW Learning Notes (VIII): Property Nodes LabVIEW Learning Notes (IX): Arrays and Clusters LabVIEW Learning Notes (X): Case Structures Other Experiment Notes
Task Requirements
- Generate a sine-wave signal with a frequency of 0-50M
- Allow a selectable sampling rate of 10M, 50M, or 100M
- Detect the signal frequency
- Output the sampled signal’s power spectrum, and restart averaging if the frequency or sampling rate changes
Implementation
- Create a Basic Function Generator on the block diagram, then press Ctrl+H to view its terminal descriptions in Context Help
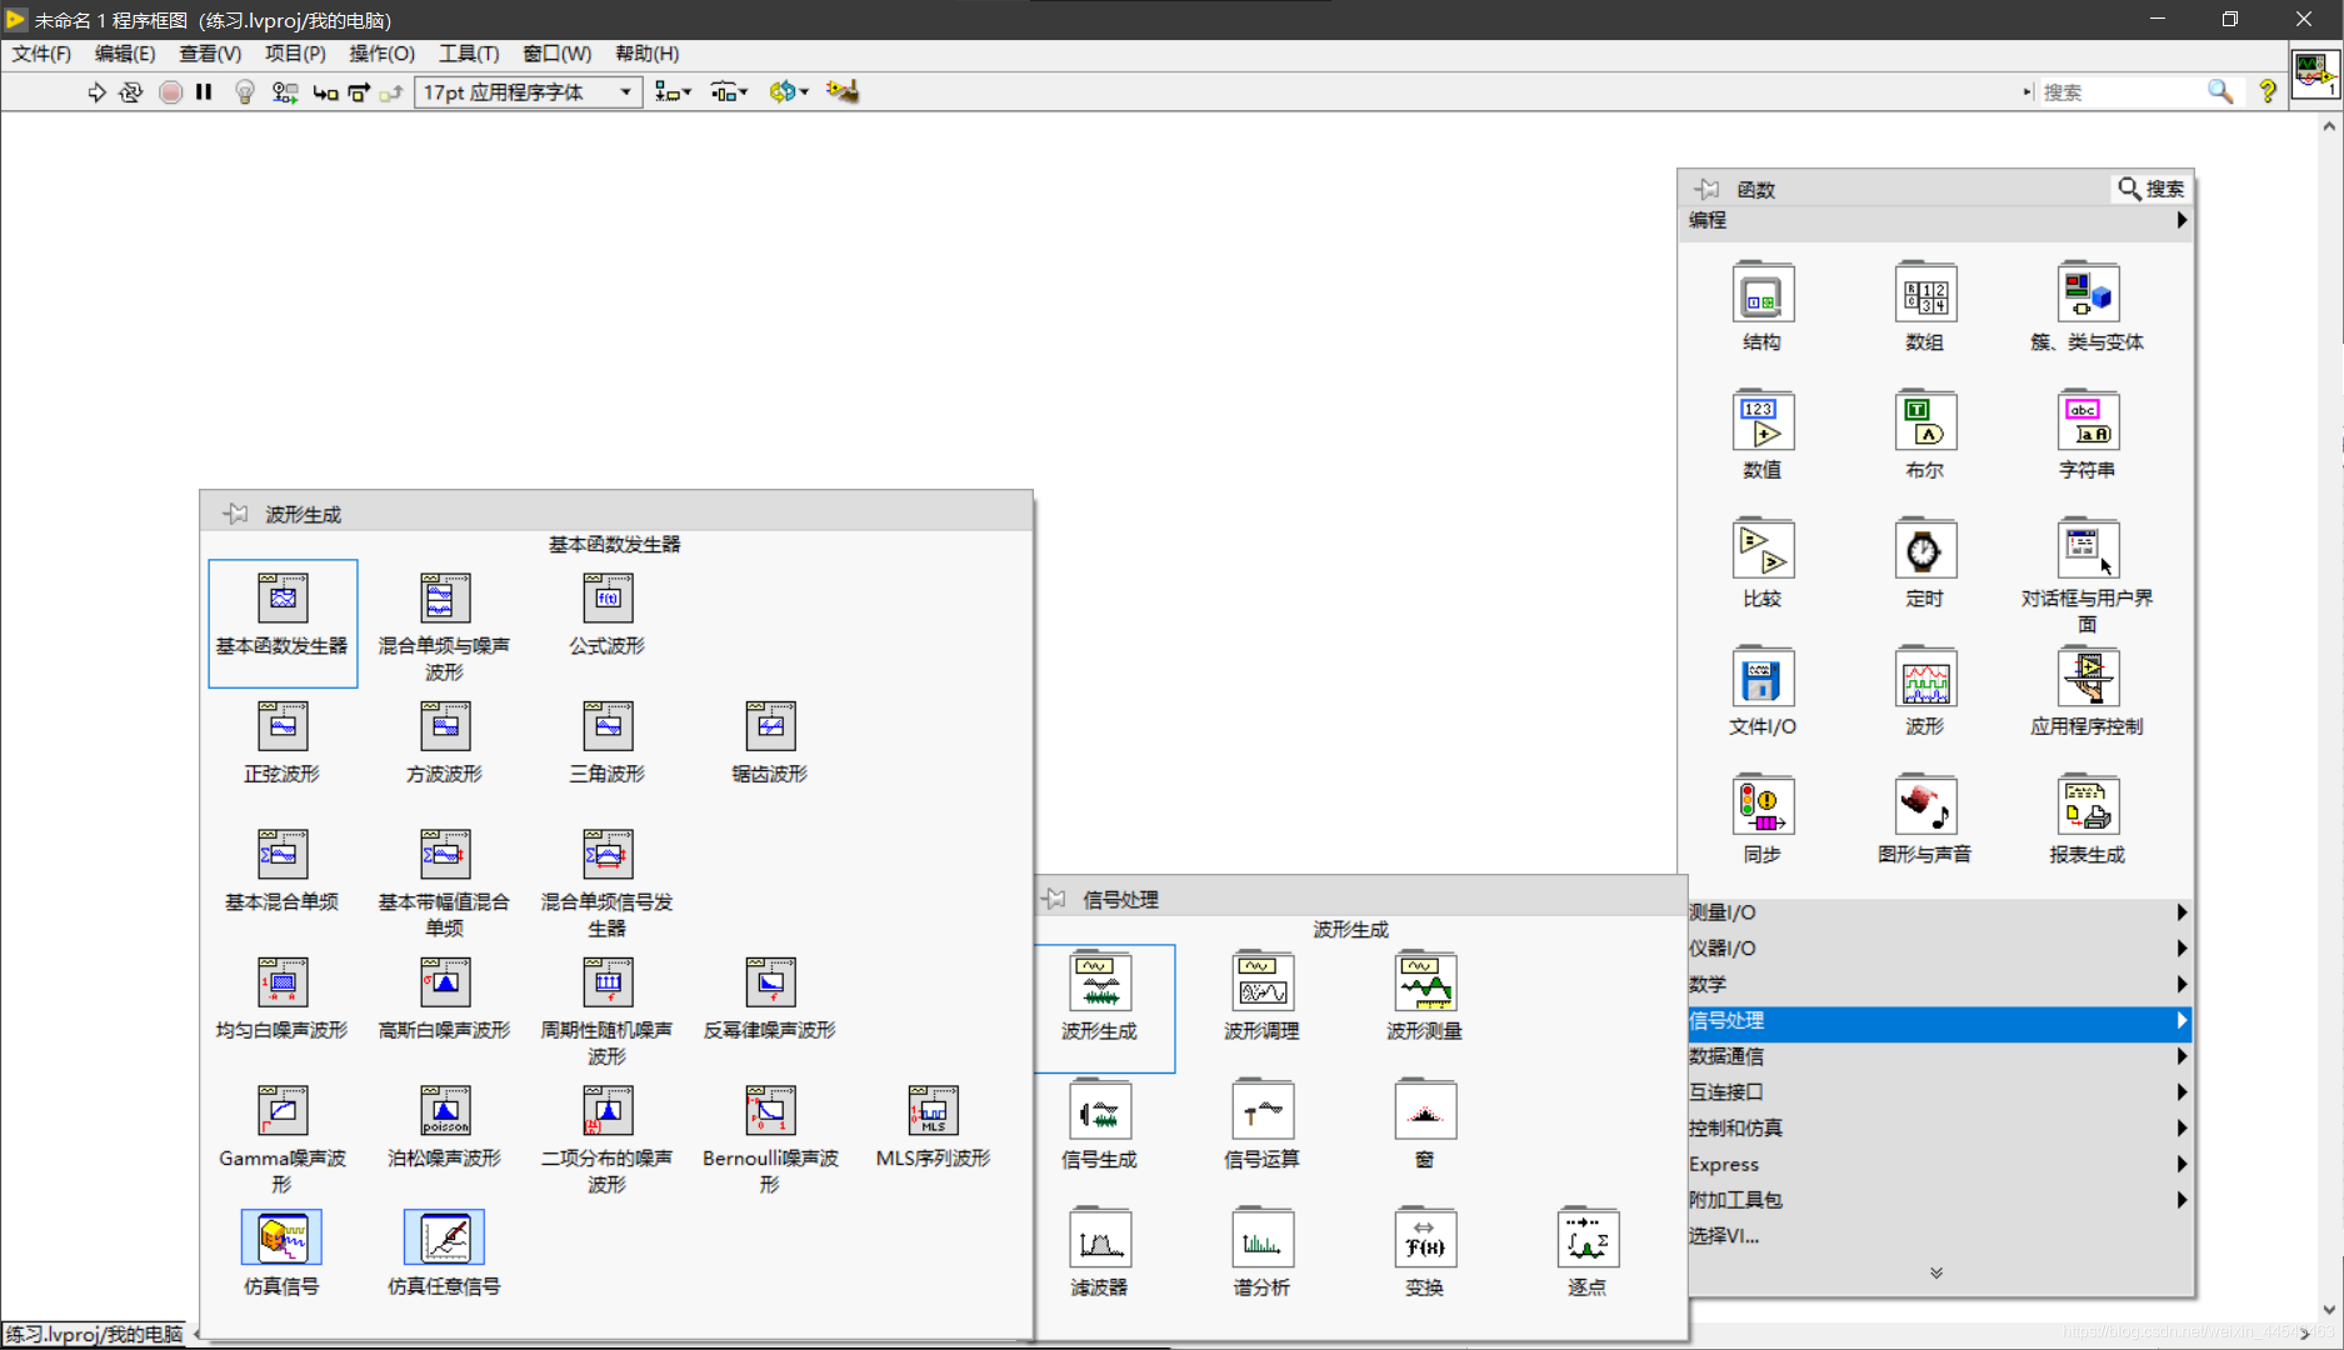

- Configure each terminal according to the task requirements. First, right-click Signal Type and create a constant for a sine wave
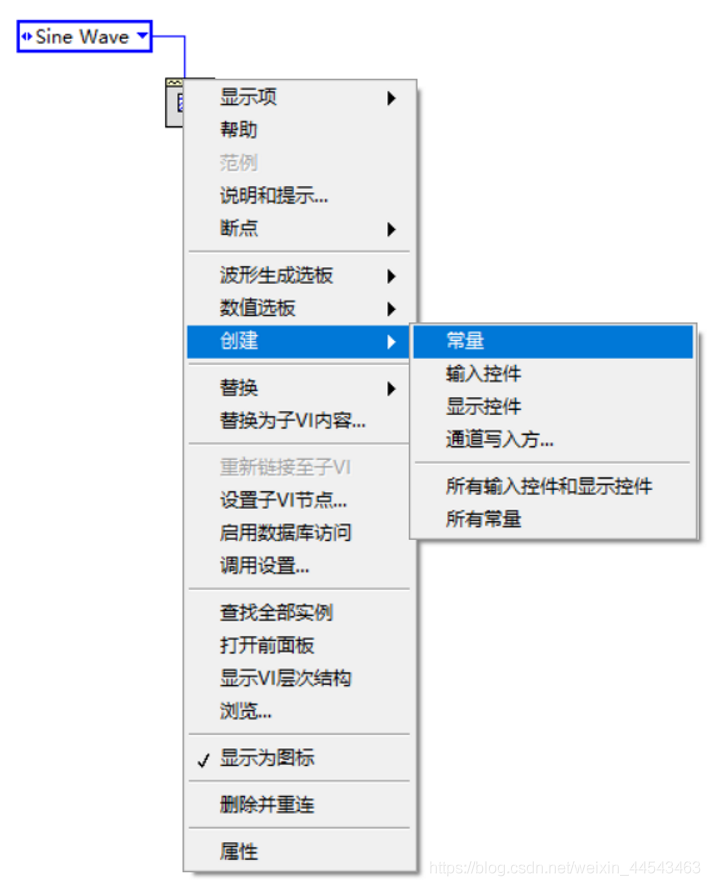
- Right-click the Frequency and Sampling Information terminals and create controls
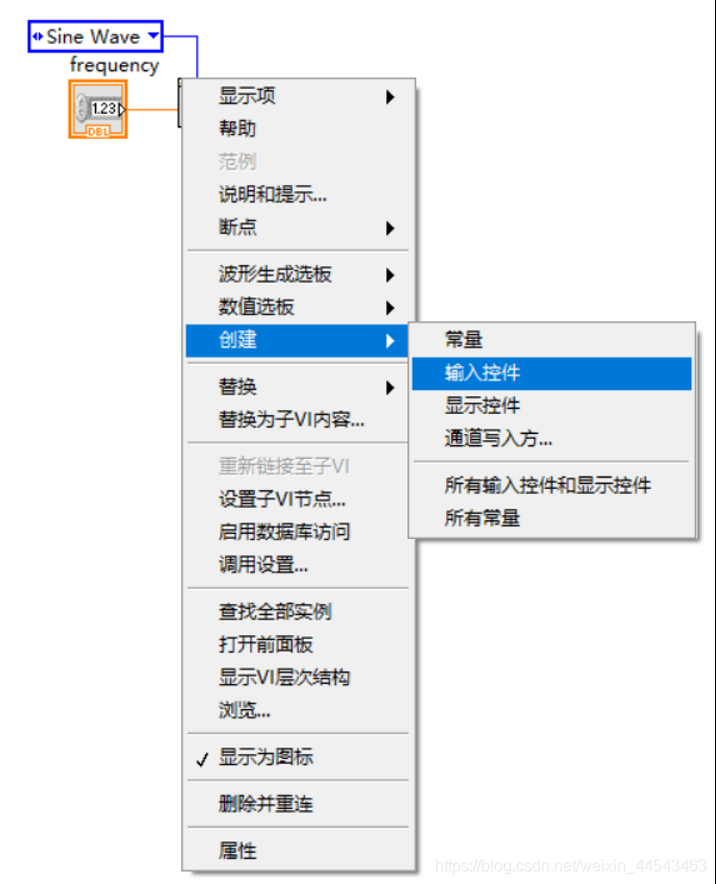
- Add two Waveform Measurements Express VIs: Extract Single Tone Information and FFT Power Spectrum and PSD

- Create indicators on the Detected Power terminal of the Extract Single Tone Information Express VI and the Power Spectrum/PSD terminal of the FFT Power Spectrum and PSD Express VI
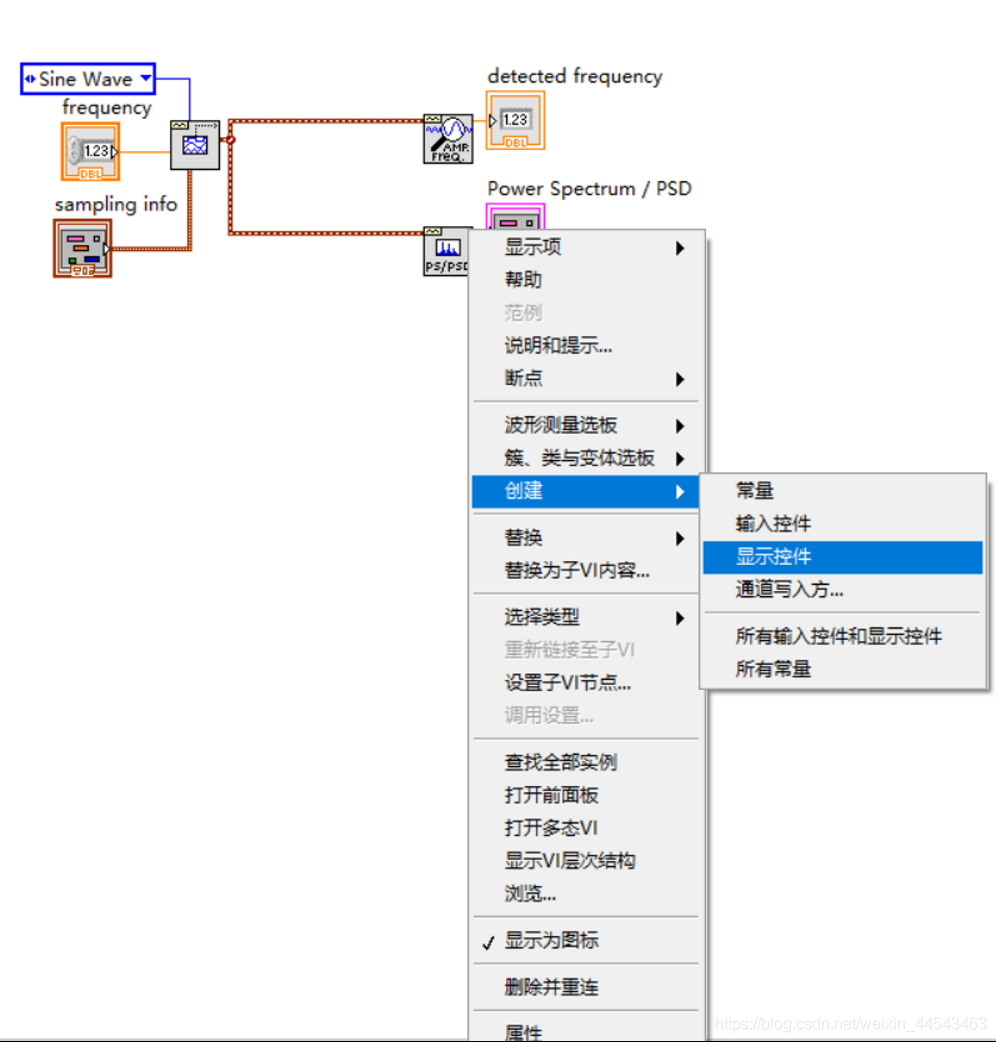
- Create a constant on the Display in dB terminal of the FFT Power Spectrum and PSD Express VI and set it to True
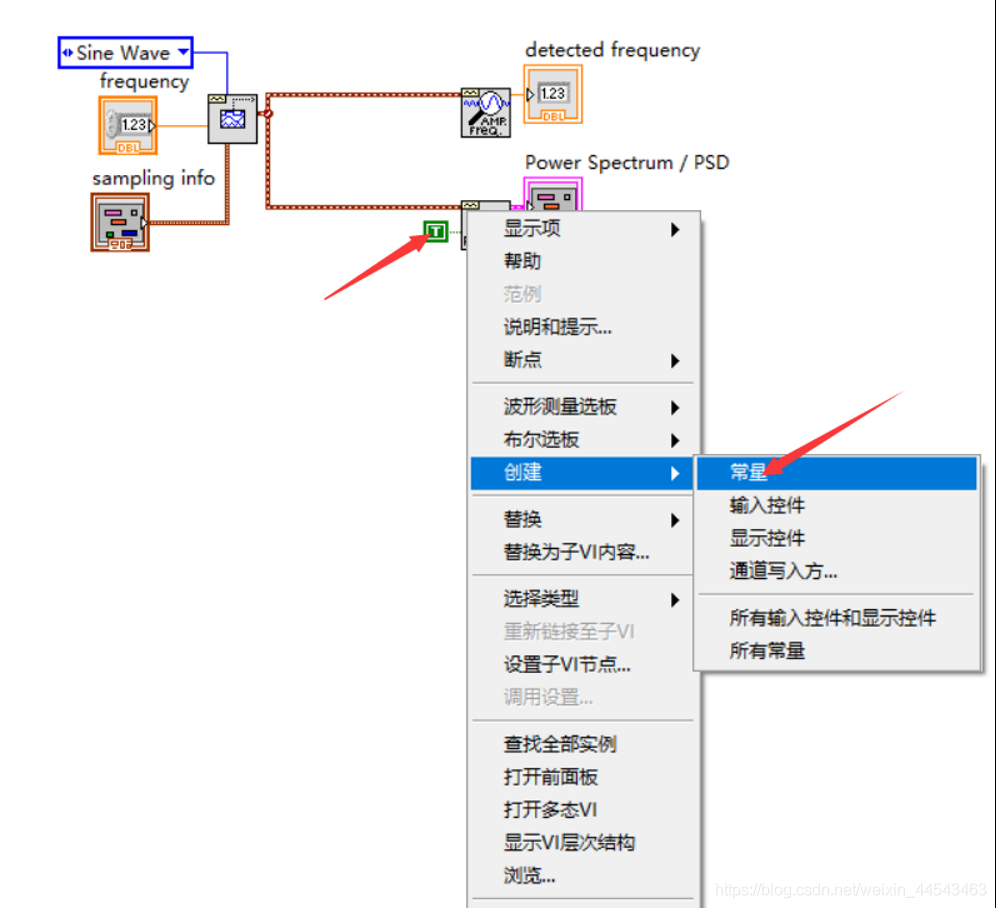
- Create a constant on the Averaging Parameters terminal of the FFT Power Spectrum and PSD Express VI and set the averaging method to RMS (root mean square) averaging
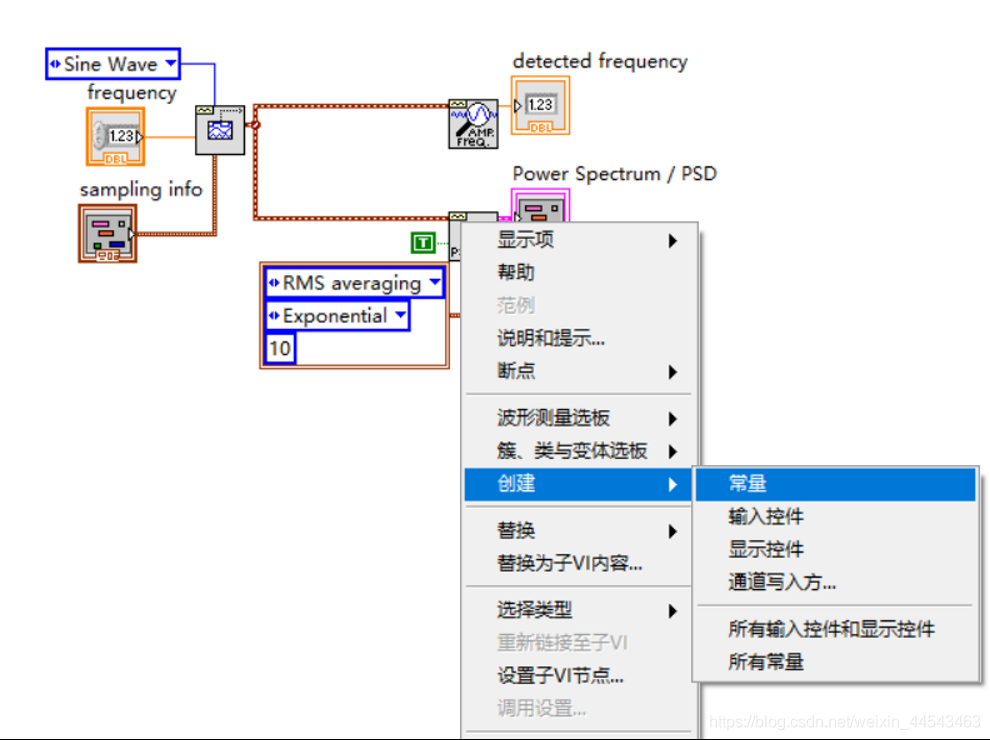

- Because averaging needs to restart, create a constant on the Restart Averaging terminal and set it to True

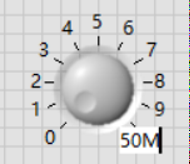
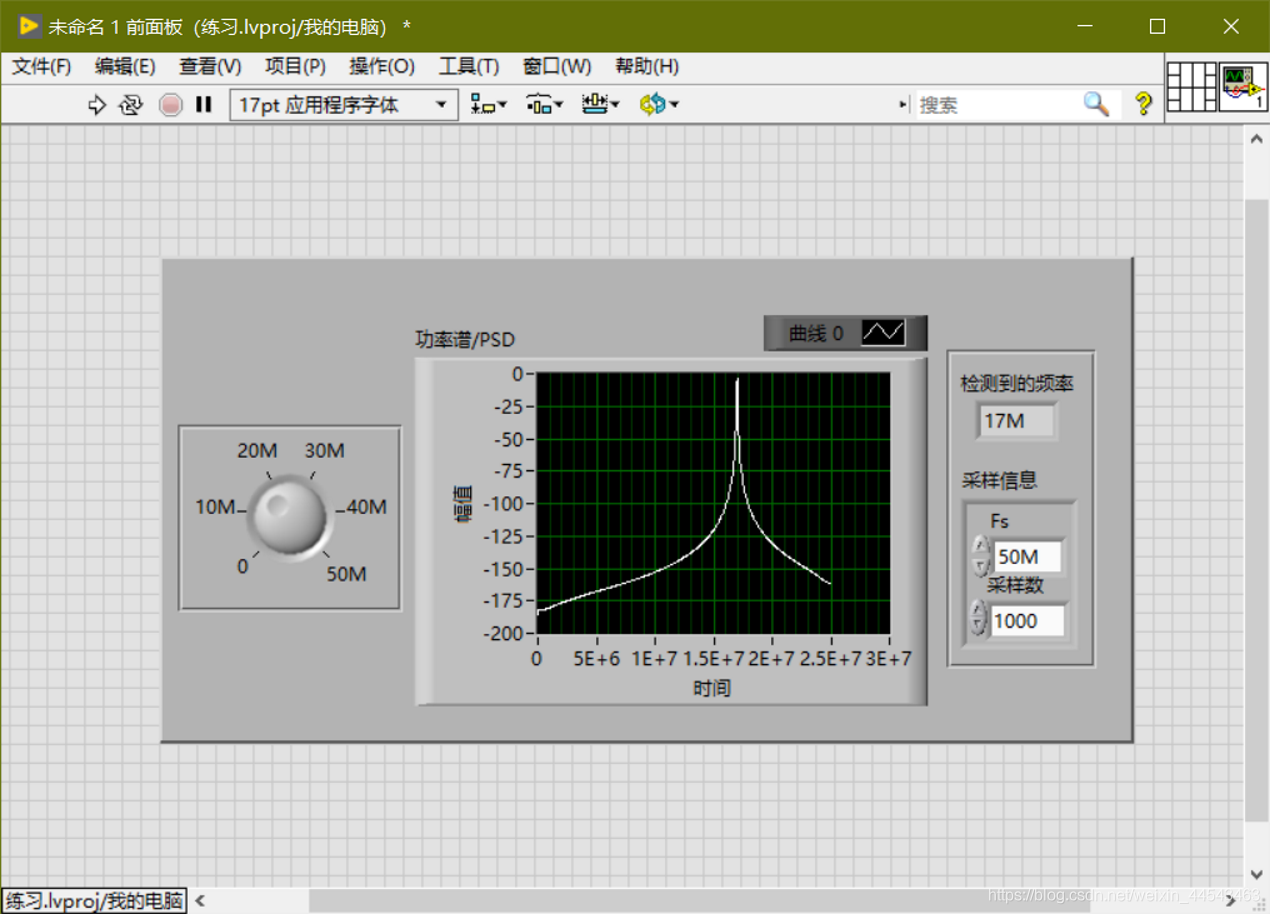
- Switch back to the front panel, replace the power spectrum indicator with a waveform graph, and replace the frequency control with a knob

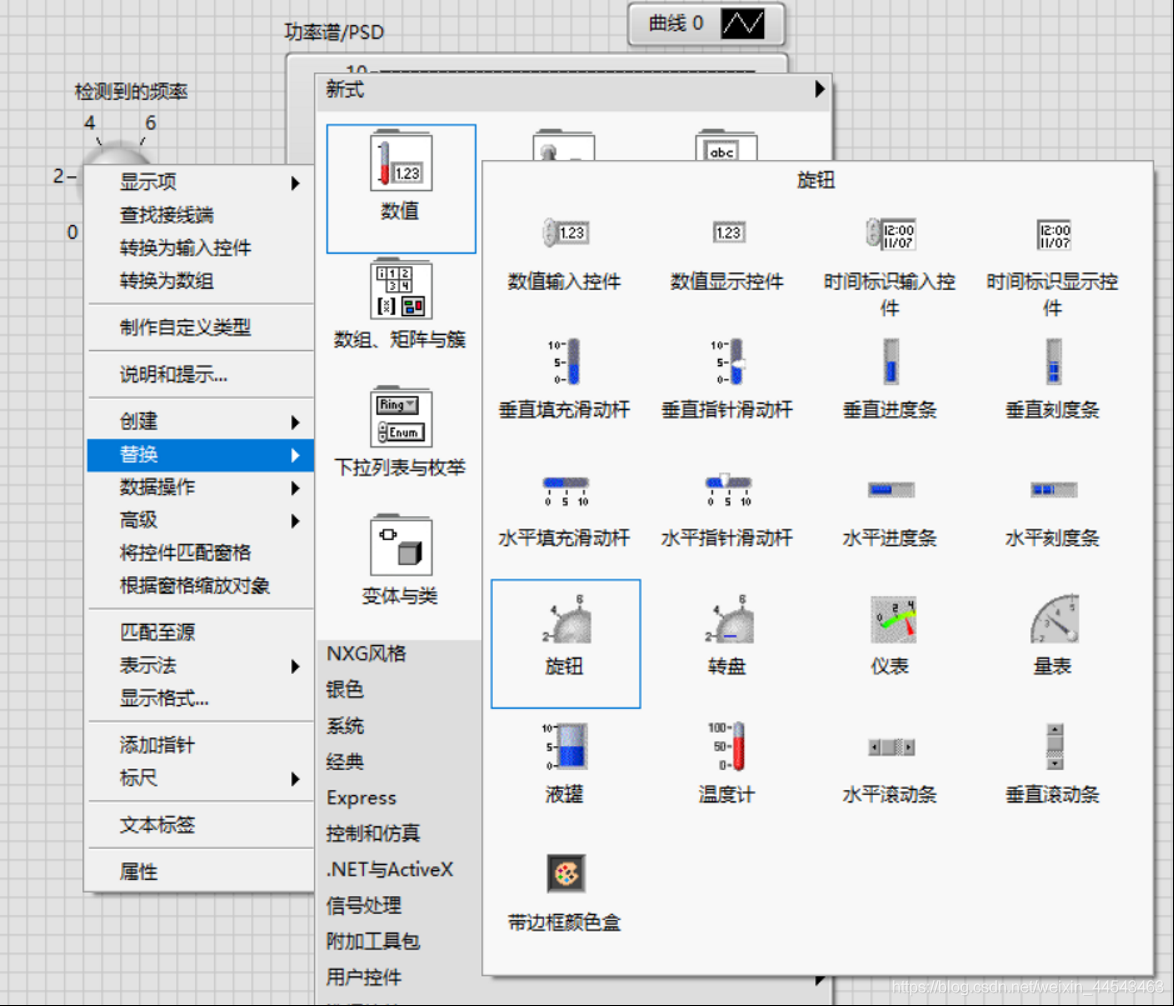
- Modify the scale around the knob

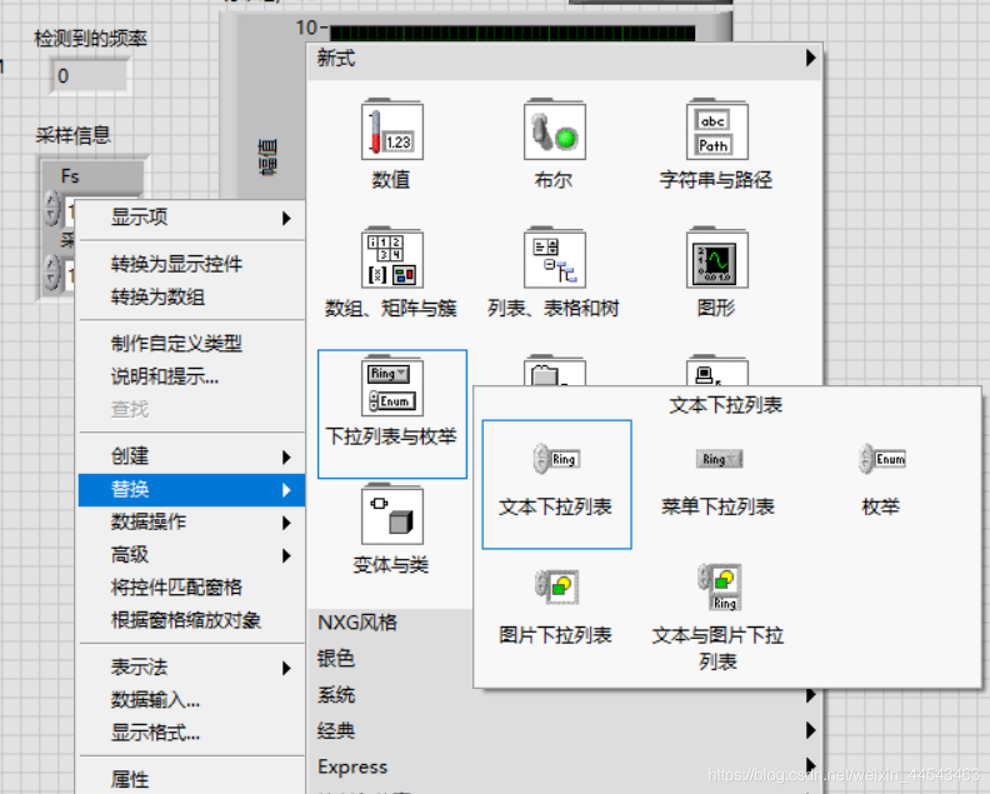
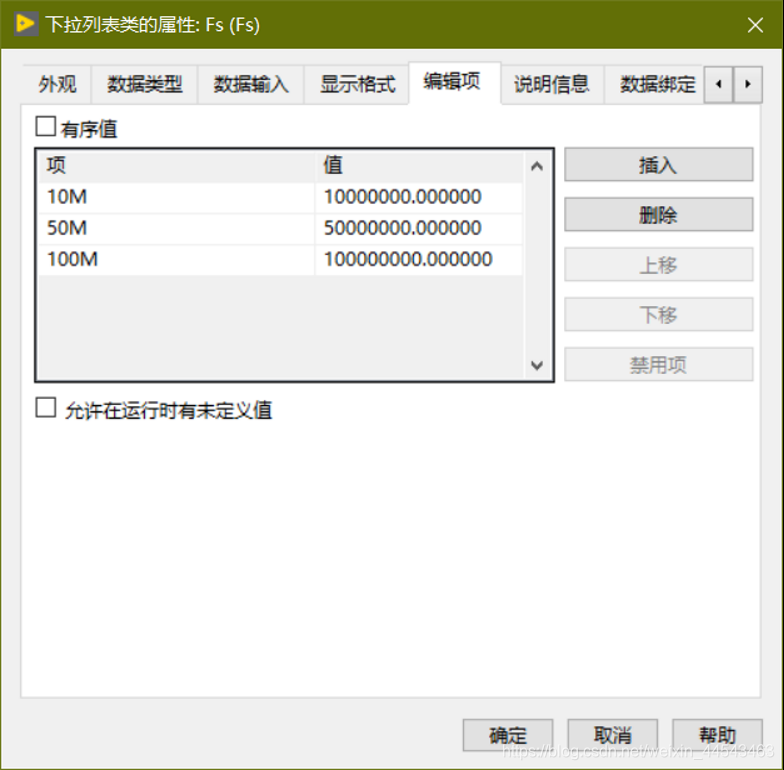
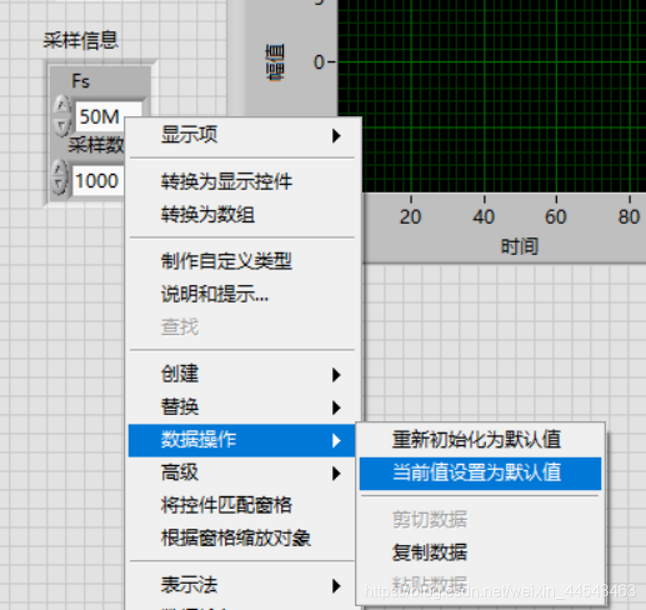
- Replace the sampling information control with a text ring, then right-click it and select Edit Items to modify its menu, setting the default value to 50M
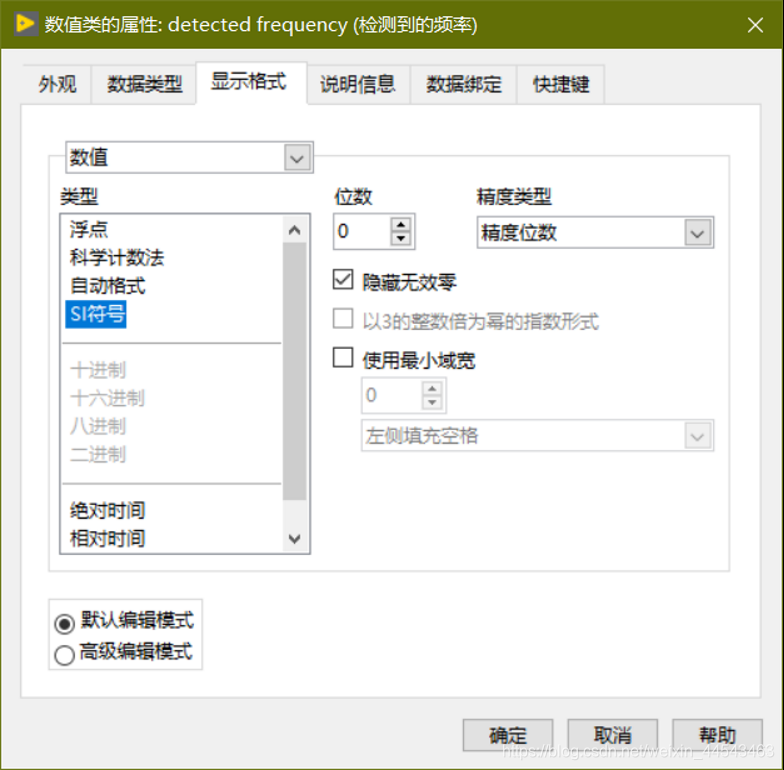
- Modify the display format of the detected frequency
- Apply some simple visual styling, then run the program
Comments