LabVIEW Series:https://blog.csdn.net/weixin_44543463/category_10714833.html
I. Introduction
1.1 For Loop
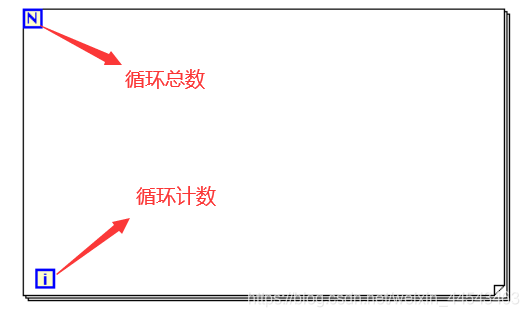
A for loop runs for a fixed number of iterations. It also has a conditional terminal that can terminate a while loop early, equivalent to the break statement in C. For loops are closely tied to array operations, and the most important function of a for loop is processing array data.
 1.2 XY Graph
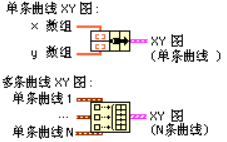
Bundle the x and y arrays to form a series of paired x-y data points. Pass the bundled result to the XY graph to generate a curve.
1.2 XY Graph
Bundle the x and y arrays to form a series of paired x-y data points. Pass the bundled result to the XY graph to generate a curve.
 1.3 Build Array
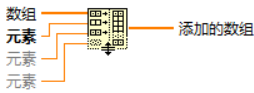
The Build Array function adds elements to an array or concatenates multiple arrays. Dragging this function downward automatically adds new input and output terminals.
1.3 Build Array
The Build Array function adds elements to an array or concatenates multiple arrays. Dragging this function downward automatically adds new input and output terminals.
 1.4 Shift Register
After adding a shift register, a box containing a triangle is added at the same horizontal position on each side of the loop structure. The box on the left represents the result of the previous iteration, while the one on the right represents the result to be input during the current iteration.
1.4 Shift Register
After adding a shift register, a box containing a triangle is added at the same horizontal position on each side of the loop structure. The box on the left represents the result of the previous iteration, while the one on the right represents the result to be input during the current iteration.

II. Experiment Objective
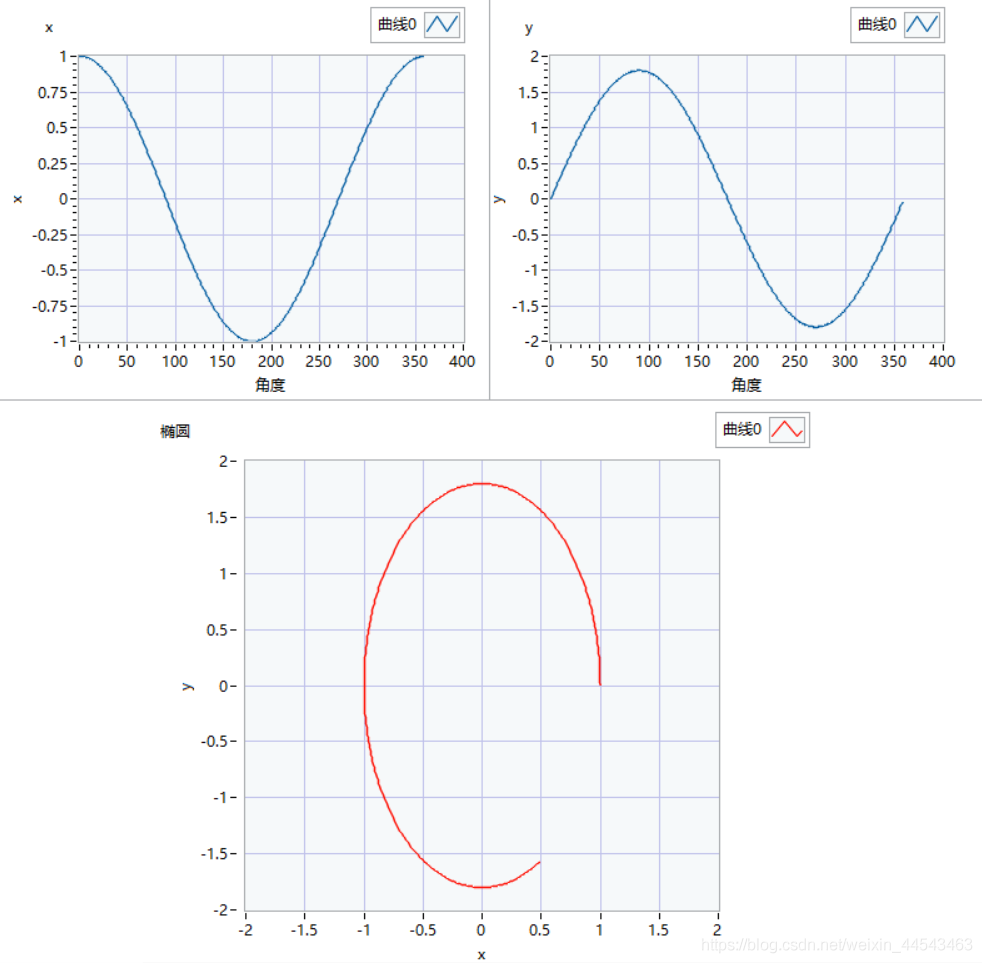
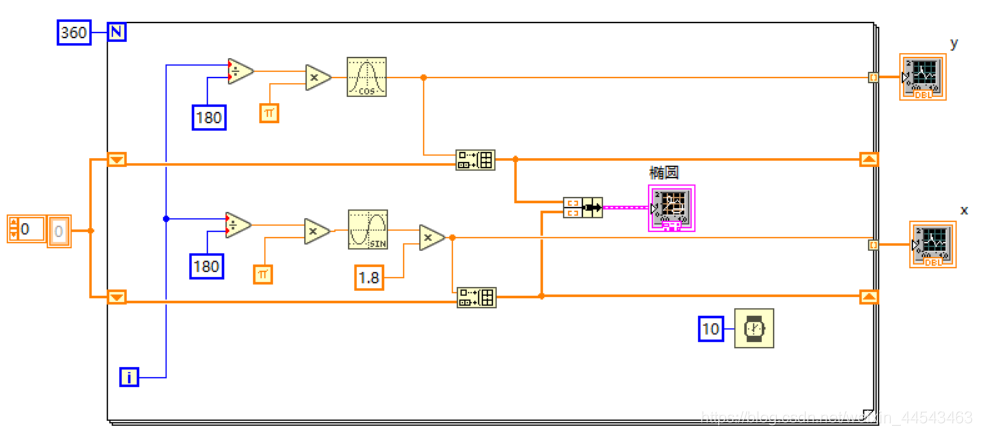
Display a curve showing how the x-coordinate changes with the angle and another showing how the y-coordinate changes with the angle. At the same time, draw an ellipse in real time to show the entire drawing process.
III. Experiment Approach
Use the loop count i to represent the changing angle. Each iteration corresponds to an angle increment of +1. The angle starts at 0 and ends at 360, so the total number of iterations is set to 360.
Consider the parametric equations of a circle, x=r·cos(φ) and y=r·sin(φ), using r=1 as an example.
Because the loop count serves as the angle, the x and y values for each iteration are calculated as follows:
Add the generated data to the arrays passed in from the shift register, then bundle the x-data array and y-data array and pass them to the XY graph.
Comments