Contents
- Part Zero: Notes
- 0.1 Shift Registers
- 0.2 Using NaN
- 0.3 Enabling and Disabling Indexing
- Part One: Continuous Five-Point Sine Motion
- 1.1 Objective
- 1.2 Implementation Approach
- 1.3 Block Diagram Design Process
- 1.3 Result
- Part Two: Sine Motion with Five Spaced Points
- 2.1 Objective
- 2.2 Implementation Approach
- 2.3 Block Diagram
- Extension—Shannon’s Sampling Theorem
LabVIEW Series: https://blog.csdn.net/weixin_44543463/category_10714833.html
Part Zero: Notes
0.1 Shift Registers
Right-click the border of a loop structure to create a shift register.
A shift register passes the value generated in the previous loop iteration to the next iteration. Shift registers appear as pairs of terminals located at corresponding positions on the borders on opposite sides of a loop.
The right terminal has an upward-pointing arrow and stores the data at the end of each iteration. LabVIEW passes the data wired to the right register to the next iteration. After the loop finishes executing, the right terminal returns the last value saved in the shift register.
A shift register must be initialized; that is, you must set the value that it passes to the first loop iteration.

0.2 Using NaN
NaN: Not a Number. To use it, simply create a constant and enter NaN. When plotting a curve, NaN is not displayed on the waveform graph.
0.3 Enabling and Disabling Indexing
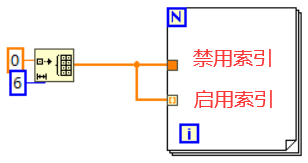
When array elements are passed into a loop structure, a terminal appears on the border of the loop structure. Enable Indexing: One array value is passed in sequentially on each iteration, and the terminal is hollow. Disable Indexing: The entire array is passed in on every iteration regardless of how the loop runs, and the terminal is solid.
Part One: Continuous Five-Point Sine Motion
1.1 Objective
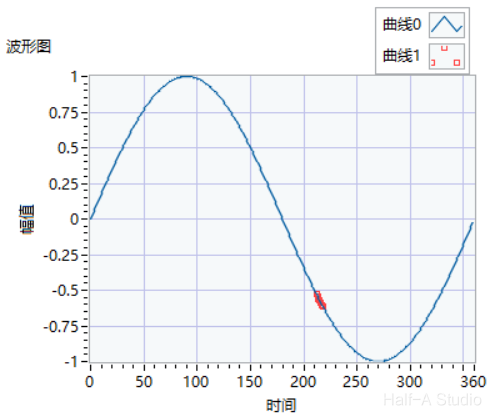
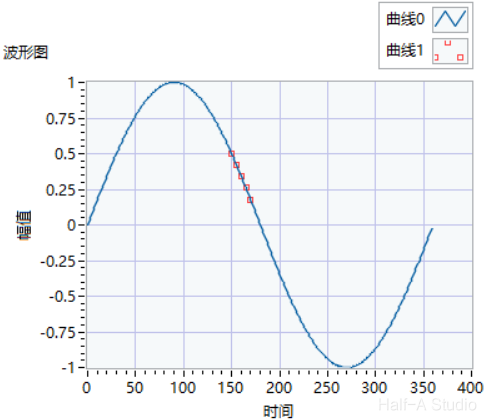
Starting with a sine curve generated in a waveform graph, create the effect of 5 consecutive points moving along the sine curve, as shown below.
1.2 Implementation Approach
(1) Generate a sine signal array. The array indices represent time, and the array contents represent the sine signal values. (2) Pass the sine signal array and an equal-length array whose elements are all NaN into the loop structure at the same time. (3) Sequentially index the current incoming value and the previous 4 values, if available, from the sine signal array, and replace the corresponding positions in the NaN array with these five numbers. (4) Each time the sine signal array passes in a number, replace the values in the NaN array once and update the waveform once. This creates the effect of 5 consecutive points moving along the sine curve.
1.3 Block Diagram Design Process
(1) Generate a sine signal array The sine signal array has a length of 360, so each i corresponds to 1°. Use the formula for converting a sine angle from degrees to radians to calculate the sine value. After 360 loop iterations, the output is a sine array covering one period.

(2) Create an equal-length array whose elements are all NaN This uses the Array Size and Initialize Array functions. Array Size accepts an array and outputs the number of elements in it. Initialize Array accepts an initialization element and an array length, then outputs an array. Here, pass in the sine signal array and then initialize an array of the same length whose elements are all NaN.

(3) Index the previous 4 values and bundle them with the current value into an array (this array will be used for element replacement in the next step) First, create a for loop. Right-click the border of the loop structure and select Add Shift Register. Then stretch the shift register on the left so that there are 4 terminals on the left and one terminal on the right, and add initial values to the shift register. Pass the sine array into the for loop, then wire it to the shift register on the right. (By default, the array is passed in using indexing, meaning that one data element is passed in on each iteration.) Use the Build Array function to bundle the current value and the previous 4 values into an array.

This implements the following behavior: Each time the array passes in a value, that value and the previous 4 values are bundled into an array. At the same time, the value enters the shift register and updates the four values in it. (4) Replace elements in the NaN array The purpose of this step is to replace the corresponding positions in the NaN array with the previous 5 bundled values. As a result, with every loop update, these 5 values in the NaN array are also updated. On the graph, this appears as 5 points moving along the sine curve. The key to this step is finding the indices of the 5 values, meaning their positions in the array. Based on the previous logic, i in the for loop on the right is the index of the last of the 5 values. The previous four values are obtained through the shift register, so the indices of the previous 4 values are successively offset by -1.
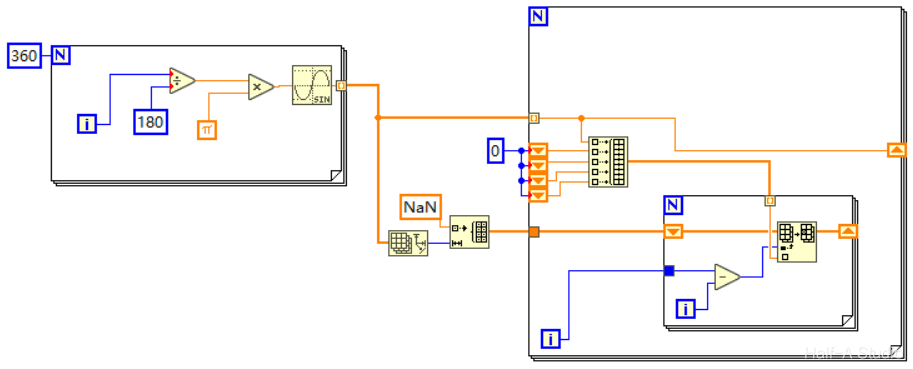
Use the Replace Array Subset function, which has three input parameters: the original array, the index of the element to replace, and the replacement element. The original array is the NaN array created earlier. Because the entire array must be passed in on every iteration, you must Disable Indexing. In addition, because each iteration of the inner for loop replaces only one value, the replaced array must be passed to the next iteration through a shift register so that element replacement can continue. For the replacement element, pass the array bundled earlier into the inner for loop through indexing, one element at a time. The length of this array also determines the number of for-loop iterations. For the replacement element index, subtract the inner loop’s i (from 0~4 over five iterations corresponding to the five values) from the outer loop’s i (the index of the last value). (5) Bundle and display the original sine array and the replaced NaN array Create a waveform graph control on the front panel. On the block diagram, use the Build Array function to connect the two arrays to the waveform graph control. (Note: The entire sine array is also passed in on every iteration, so disable indexing.) Then add a wait delay to the large loop. Otherwise, it will finish immediately when started, and you will not be able to see the points moving.

Note: It is best to change Plot 1 (the 5 points) on the front panel to another line style; otherwise, the effect will not be visible.

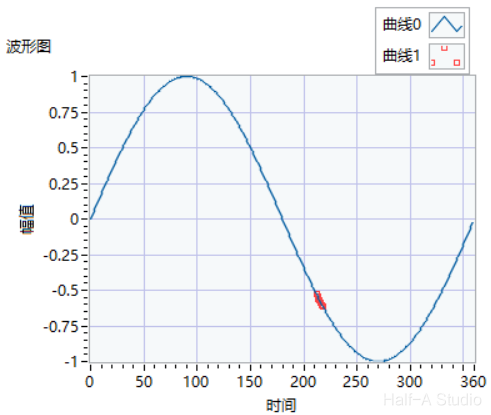
1.3 Result
Part Two: Sine Motion with Five Spaced Points
2.1 Objective
This still shows five points moving along a sine curve, but this time the five points are spaced apart instead of being consecutive.
2.2 Implementation Approach
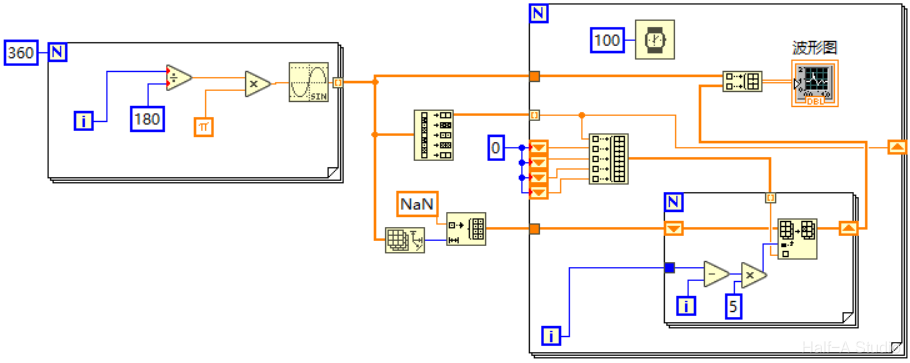
The objective is to replace nonconsecutive points in the NaN array with the corresponding sine coordinate values. Therefore, simply multiply the replacement-array index in the inner loop by a coefficient to replace nonconsecutive indices. For example, if the coefficient is 5, the result of outer i minus inner i was previously 0-1-2-3-4, and the result of outer i minus inner i is now 0-5-15-20-25. Although the indices have changed, the replacement elements have not: they are still the preceding elements. This is not the result we want. We also need to reduce the incoming array at equal intervals by the same factor, then use the shift register to find the previous 4 values. The Decimate Array function can accomplish this.
2.3 Block Diagram
Extension—Shannon’s Sampling Theorem
To recover an analog signal without distortion, the sampling frequency should be no less than 2 times the highest frequency in the analog signal’s spectrum.
Comments